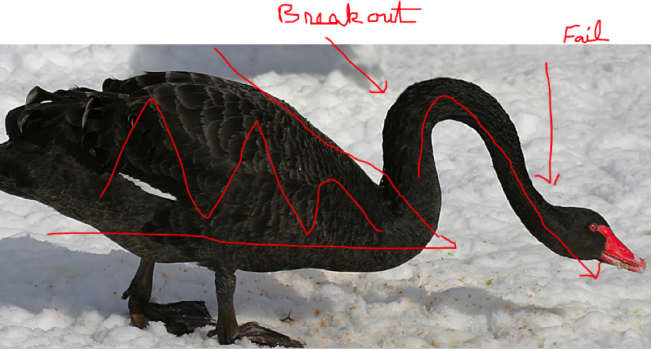
Is The $/Yen About To Take A Swan Dive?
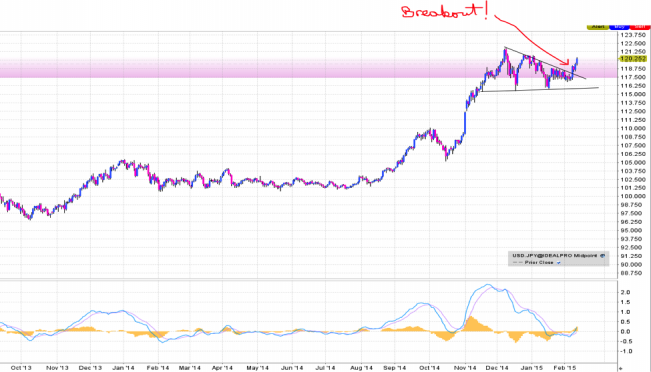
When I looked at the chart of the $/Yen I recognized the formation immediately. Here is the current chart of $/Yen. Notice the breakout to the upside of a flat-bottomed triangle. Now where did we see something similar?
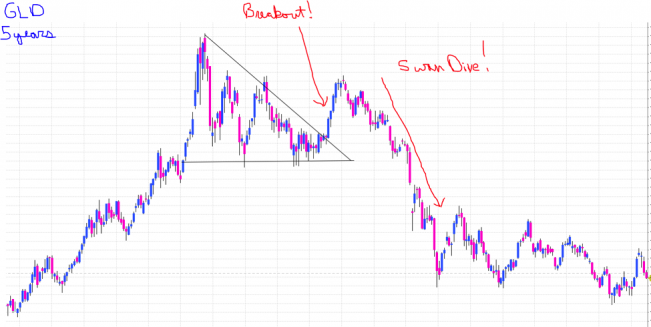
This is a chart of GLD going back five years. Notice how GLD topped, formed a flat bottomed triangle and broke up out of it. What happened next was a swan dive.
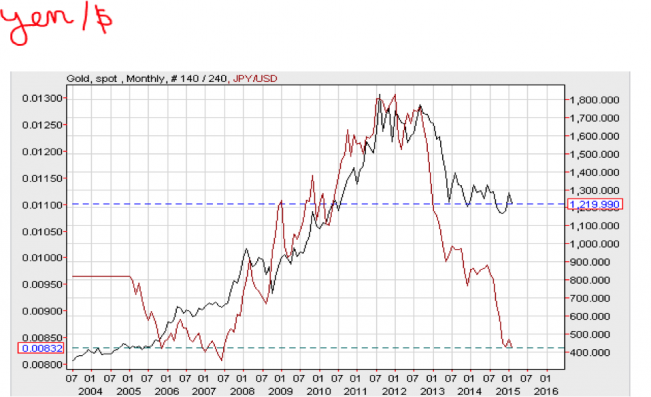
The similarities are most certainly there, as the $/Yen has run for years much like gold did into 2011. If that chart plays out the $/yen is set to plunge and that matters to gold investors for one reason. Gold trades in lockstep with the Yen/$ or the inverse of what is commonly quoted…$/Yen.
As gold plumbs major support in the low 1200’s the $/Yen has hit major resistance. When coupled with the COMP approaching a double top going back to the year 2000, one has to wonder if stocks aren’t about to rollover as the $/Yen goes down with it. All of which would give investors in gold a welcome break from the misery of the past 3 ½ years.
Written by: It’s a Mystery
Popular Blog Posts by Koos Jansen
 China’s Secret Gold Supplier is Singapore
 Audits of U.S. Monetary Gold Severely Lack Credibility
 China Gold Import Jan-Sep 797t. Who’s Supplying?
 The Gold-Backed-Oil-Yuan Futures Contract Myth
 Estimated Chinese Gold Reserves Surpass 20,000t
 Did the Dutch Central Bank Lie About Its Gold Bar List?
 PBOC Gold Purchases: Separating Facts from Speculation
 U.S. Mint Releases New Fort Knox Audit Documentation
 China Net Imported 1,300t of Gold in 2016
 Why SGE Withdrawals Equal Chinese Gold Demand and Why Not


 Koos Jansen