Unprecedented Total Chinese Gold Demand in 2013
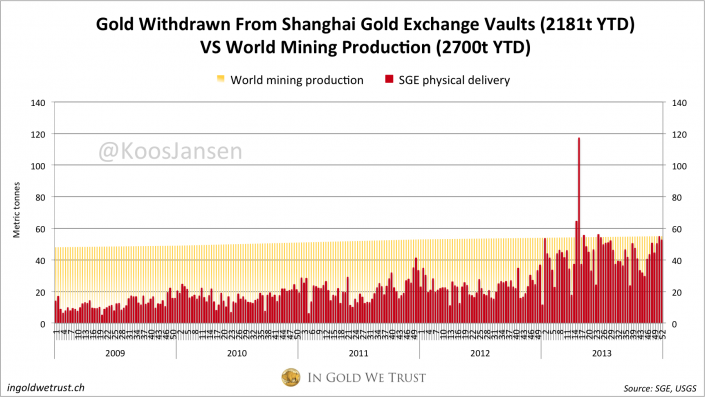
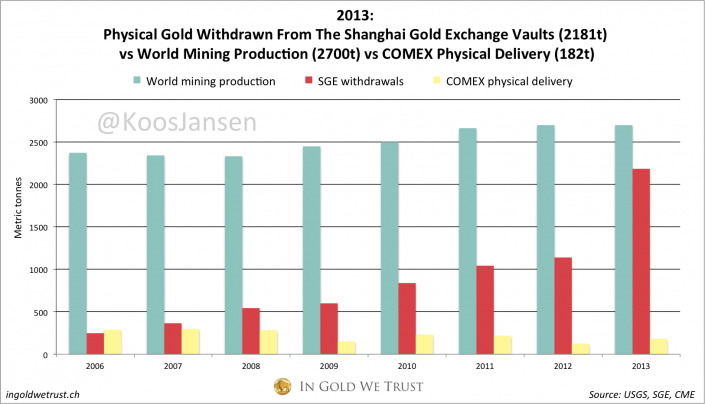
Friday the numbers were released on total Chinese gold demand for 2013. Total demand can be measured by the amount of physical gold that is withdrawn from the vaults of the Shanghai Gold Exchange. In the last full trading week (#52, December 23 – 27) of 2013 there were 53 tons of physical gold withdrawn, which brings the yearly total to 2181 tons. Yes, total Chinese demand for 2013 was 2181 tons, excluding PBOC purchases. All my sources in the mainland state the PBOC would never buy its gold through the SGE, so total demand including PBOC purchases may have reached well over 2500 tons. Which would imply total net import was 2000 tons (as I have written extensively about here).
Since November demand for physical gold has surged, weekly withdrawals have been above average, transcending weekly global mine production. Not only did we observe strong demand at the SGE, it was also perceived in an incredible shopping spree at jewelry shops around new year. From Want China Times:
….Many Chinese gold buyers have been happy to see the price drop as this is traditionally peak season for gold purchases before the Lunar New Year holiday and the recent slump will allow them to buy gold at relatively low prices.
“It is a good deal. It can be seen as an investment when gold prices go up in the future," a customer said.
The sales had surged by at least 20% in December 2013 from a month earlier and were up by 15%, compared with the same period in 2012.
Of the sold items, products related to the upcoming Year of Horse were the most sought after in stores.

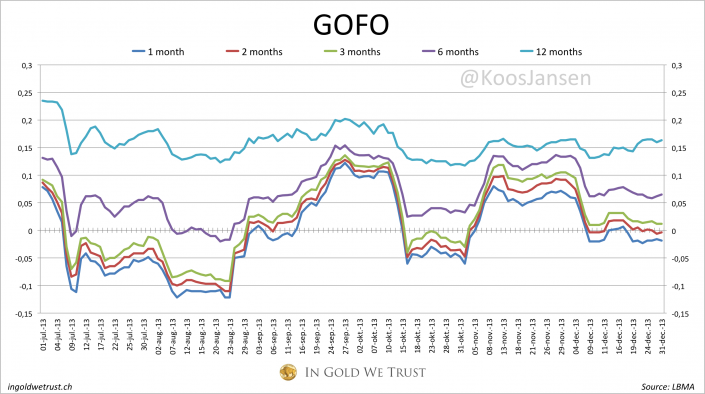
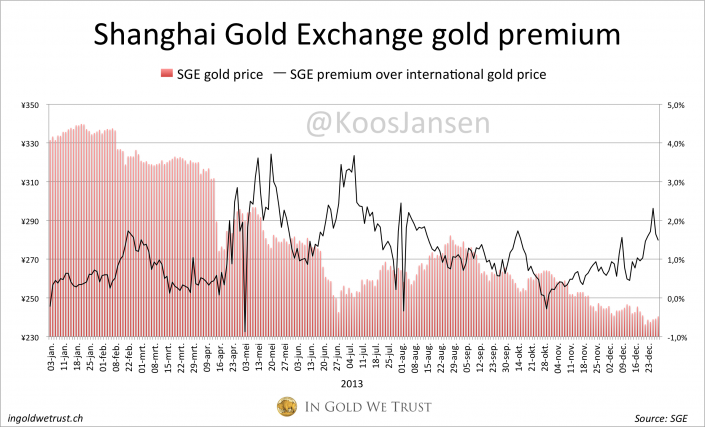
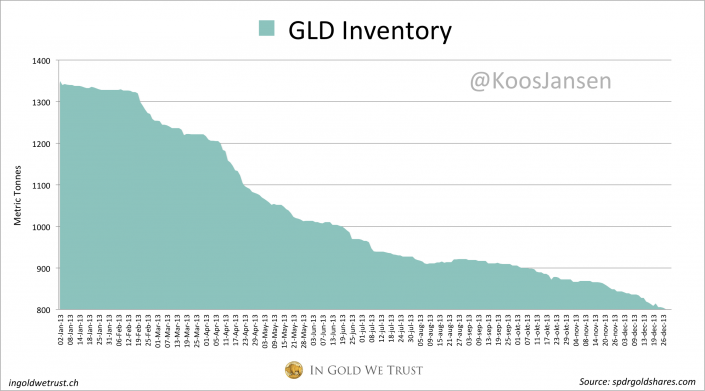
Throughout week 52 GOFO has remained negative in London, GLD lost 4.5 tons and on the Shanghai Gold Exchange premiums increased to 2 %.
Overview Shanghai Gold Exchange data week 52
– 53 metric tonnes withdrawn from the SGE vaults in week 52 (23-12-2013/27-12-2013)
– w/w – 3.95 %
– 2181 metric tonnes withdrawn in 2013
– weekly average 41.94 tonnes in 2013
For more information on SGE withdrawals read this, this, this and this.
This is a screen dump from Chinese SGE trade report; the second number from the left (本周交割量) is weekly gold withdrawn from the vault, the second number from the right (累计交割量) is the total YTD.
This chart shows SGE gold premiums based on data from the SGE weekly reports (it’s the difference between the SGE gold price in yuan and the international gold price in yuan).
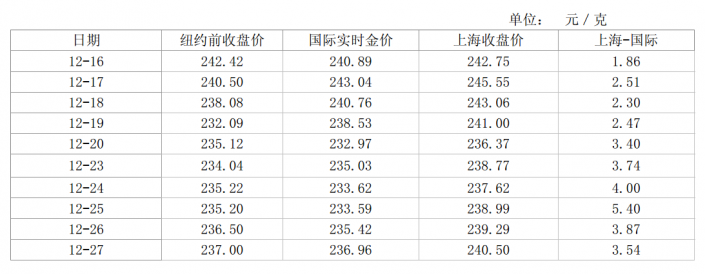
Below is a screen dump of the premium section of the SGE weekly report; the first column is the date, the third is the international gold price in yuan, the fourth is the SGE price in yuan, and the last is the difference.
Overview Chinese Gold Demand 2013
2013 has been a spectacular year wherein the pice of gold fell 29 %, but Chinese gold demand has been unprecedented and may have reached, PBOC purchases included, over 2500 tons. Exposing a disparity between the gold price set by derivatives and supply and demand for the underlying good. The divergence strongly hints at price manipulation, of which the Chinese would have been the largest beneficiaries. China has $3.5 trillion in foreign exchange (of which at least 1.7 trillion denominated in USD) and is aware the US is forced to devalue their currency; evaporating China’s reserves. For this reason China has a strong incentive to diversify away from the USD into gold. Hence the enormous physical gold purchases in 2013.
In January 2013 USGS forecasted global mining production would be 2700 tons for the year, but due to the drop in the gold price this may turn out significantly lower as mines were forced to shut down.
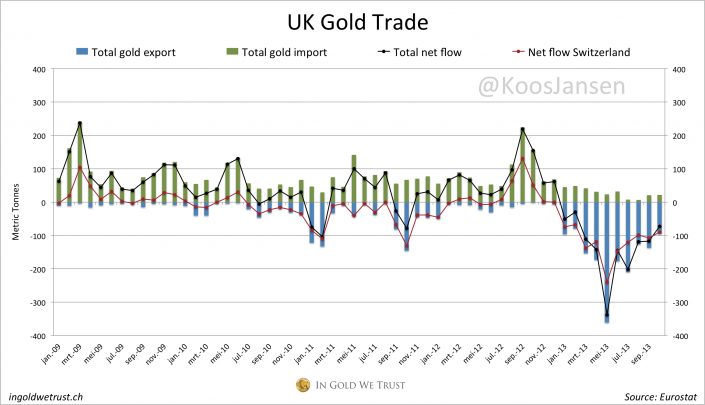
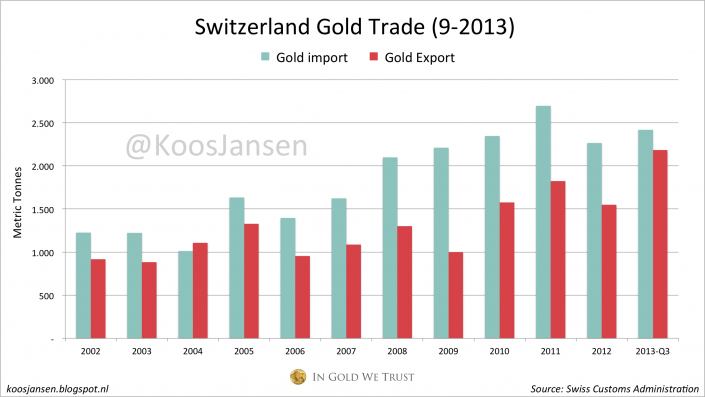
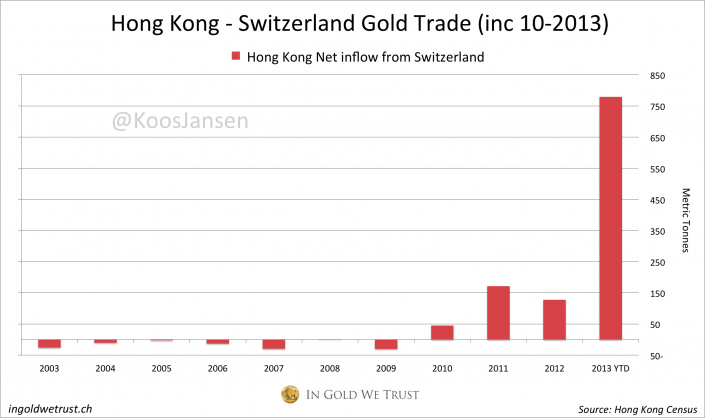
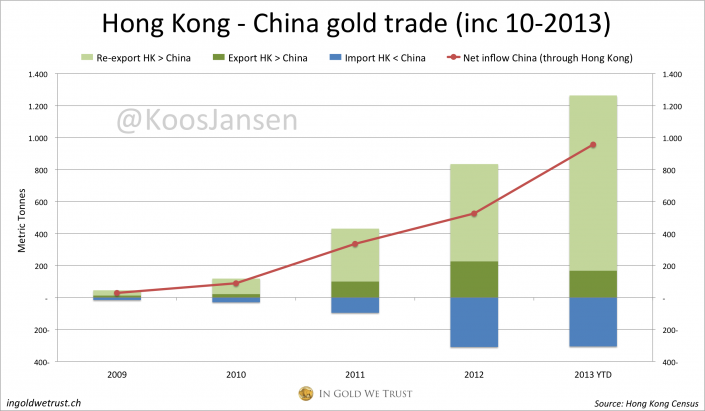
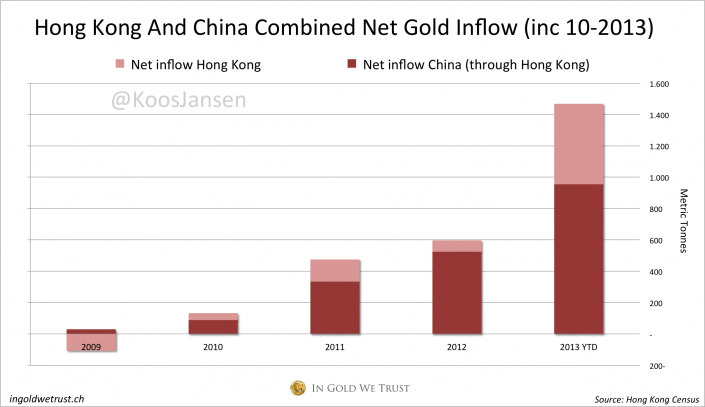
A lot of the gold sold on the SGE was sourced via Hong Kong and Switzerland from the UK. The trade numbers from these countries from the last months haven’t been published yet, though in the first ten months of 2013 the UK has net exported 1199 tons (annualized 1439 tons) to Switzerland, Switzerland has net exported 779 tons (annualized 935 tons) to Hong Kong, and Hong Kong has net exported 957 tons (annualized 1148 tons) to the mainland. Hong Kong itself net imported 510 tons of gold over this period, annualized 612 tons. The UK’s primary seller was the world’s largest ETF holding GLD, whose inventory dropped by 551,7 tons.
2014 will be an exciting year; Chinese gold demand is not likely to slow down but supply is running dry. By the way, the rest of the world will also demand gold as all developed economies in recent years have been kept alive by the printing press, whereby the price mechanism is completely destroyed, a path of no return nor good outcome. Stretching the end of the global fiat experiment.
Popular Blog Posts by Koos Jansen
 China’s Secret Gold Supplier is Singapore
 Audits of U.S. Monetary Gold Severely Lack Credibility
 China Gold Import Jan-Sep 797t. Who’s Supplying?
 The Gold-Backed-Oil-Yuan Futures Contract Myth
 Estimated Chinese Gold Reserves Surpass 20,000t
 Did the Dutch Central Bank Lie About Its Gold Bar List?
 PBOC Gold Purchases: Separating Facts from Speculation
 U.S. Mint Releases New Fort Knox Audit Documentation
 China Net Imported 1,300t of Gold in 2016
 Why SGE Withdrawals Equal Chinese Gold Demand and Why Not


 Koos Jansen

