April 2017 Gold Market Charts
Each month, BullionStar’s chart wrap-ups profile a series of gold market charts from the extensive GOLD CHARTS R US website. Most of the charts featured have recently been updated with the latest data from March 2017 and in some cases data from April 2017. The charts profiled have been selected so as to capture the most important trends and developments currently occurring in the world’s major physical gold markets.
On the BullionStar website you will also find a large selection of dynamic charts under the BullionStar Charts menu. The data for these charts covers precious metals, major currencies, stock indices and major stocks, other commodities, and also BullionStar bullion products. The charting functionality within BullionStar’s charts allows every asset or financial instrument listed to be measured in terms of every other asset or instrument listed.
Shanghai Gold Exchange (SGE) – Gold Withdrawals
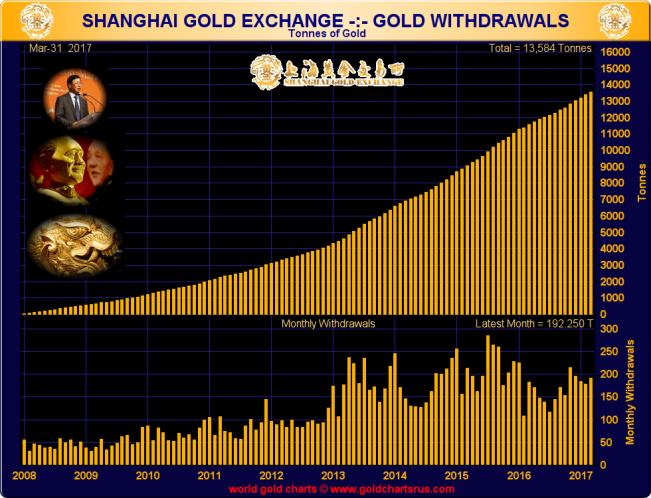
March saw 192.25 tonnes of physical gold withdrawn from the vaults of the Shanghai Gold Exchange (SGE). This is the highest monthly withdrawal total so far in 2017, surpassing February’s 179 tonne figure and January’s 184 tonne figure.
SGE gold withdrawals are a suitable proxy for Chinese Wholesale gold demand – as explained in the Mechanics of the Chinese Gold Market article on BullionStar’s website.
For Q1 2017, SGE gold withdrawals have reached a cumulative 555.25 tons, which when annualised is a staggering 2221 tonnes. A continuation of these SGE withdrawal levels for the rest of the year would result in a 20% increase from 2016’s figure, when 1970 tonnes of gold was withdrawn from the Exchange, and would be the second highest year on record after 2015, when a massive 2596 tonnes of gold flowed out of the Exchange vaults.
Chinese and Indian Gold Demand (CHINDIA)
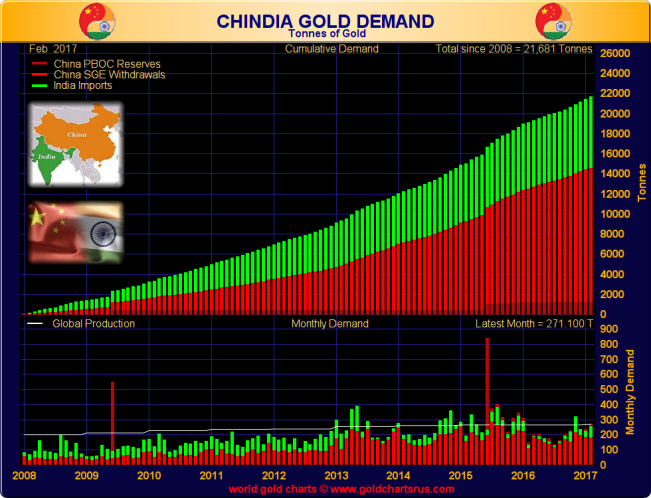
The below ‘CHINDIA’ chart represents 3 components, namely Indian gold imports, Shanghai Gold Exchange gold withdrawals, and Chinese central bank (PBoC) gold holdings changes. These 3 components together act as a proxy for combined Indian and Chinese physical gold demand. Since the PBoC does not buy gold on the Shanghai Gold Exchange, the addition of PBoC gold holdings to the calculation will not lead to double counting.
Since Indian trade statistics are quite slow in being published, the February data for Indian gold imports is only now becoming available. Therefore the data in the latest CHINDIA chart is for February.
On a combined basis for February, Indian gold imports + SGE gold withdrawals + changes to official Chinese gold reserves totalled 271 tonnes. Net Indian gold imports for February were 77.9 tonnes. SGE gold withdrawals in February were 179.23 tonnes. Based on PBoC/SAFE data, China’s official gold reserves dropped by 14 tonnes in December, but rebounded by 14 tonnes in February (possibly due to a calculation change). This 14 tonnes was therefore added back to the CHINDIA total in February, hence the 271 tonne total.
Russian Gold Reserves
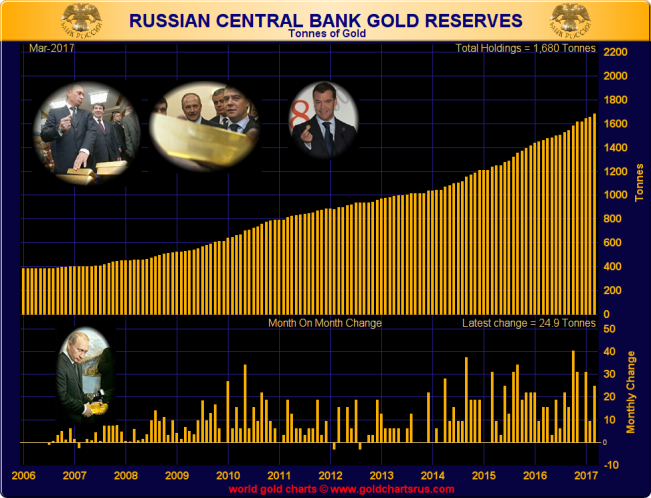
The central bank of the Russian Federation, Bank of Russia, bought 800,000 ozs of gold to add to its official reserves in March. This is equivalent to 24.9 tonnes. The March increase was a sizeable one compared to February’s purchases of 300,000 ozs (9.3 tonnes), and was more on a par with Russia’s January purchase of 1 million ozs of gold (31.1 tonnes). Official Russian gold reserves now stand at 1680 tonnes.
The Bank of Russia has now bought 65.3 tonnes of gold during the first quarter of 2017, which on an annualised basis would be 261 tonnes or 8.4 million ounces. The Russians will probably not maintain this rate of gold accumulation for the entire year, and latter months could see smaller monthly purchases but would still come in with full year gold purchases in the 200 tonne range, similar to 2016 and 2015.
Transparent Gold Holdings – ETFs and Others
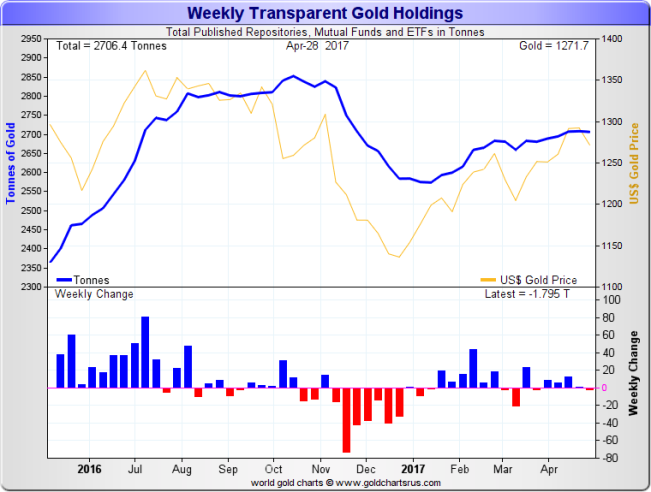
The US Dollar gold price traded in a range of $50 during April. After starting the month near $1250 and ebbing slightly to $1245, the price rose to near $1295 by mid-month before drifting back to the $1265 region by month-end.
Gold-backed Exchange Traded Funds (ETFs) and other similar products and vehicles tracked in the following chart saw their combined holdings increase by a marginal 20 tonnes to so during April due to some small inflows in the early weeks of the month. These ETFs and vehicles now hold approximately 1270 tonnes of physical gold.
Swiss Gold Imports and Gold Exports
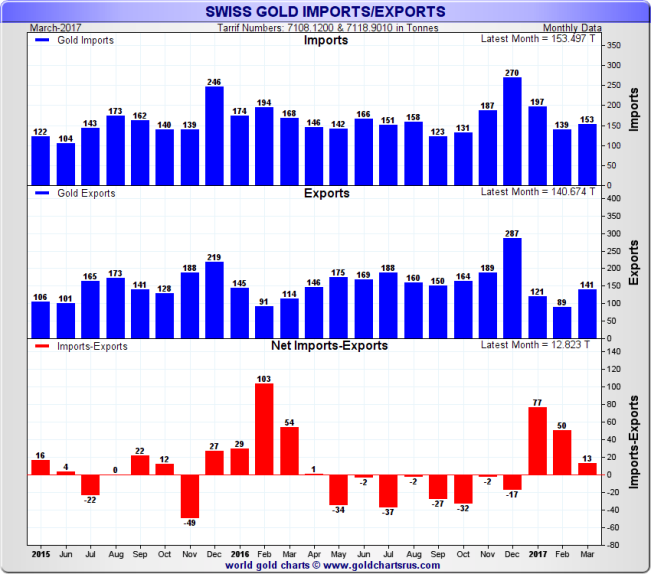
Swiss trade data shows that Switzerland imported 153 tonnes of non-monetary gold in March 2017, while exporting 141 tonnes, implying net gold imports of 13 tonnes for the month. For Q1 2017, Switzerland has net imported 140 tonnes of gold. This signifies either a build-up of investment gold holdings or a build-up of gold refinery inventories, or both.
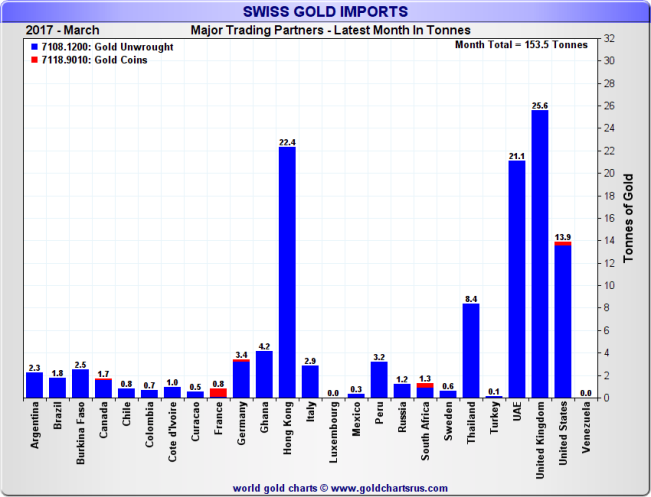
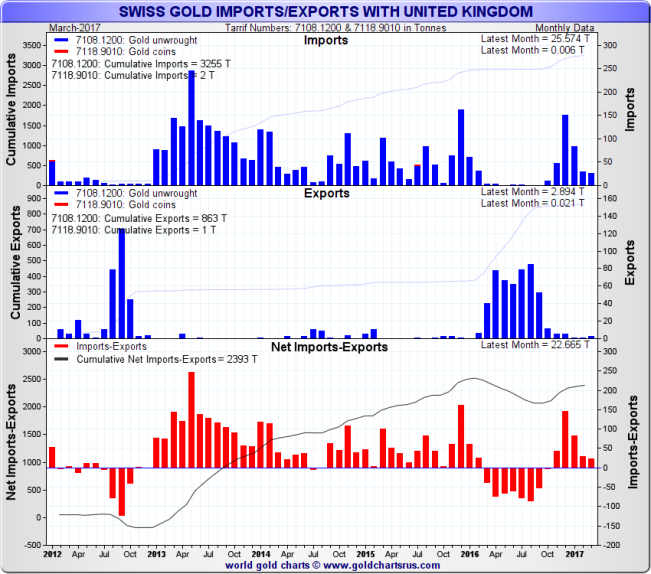
Over 50% of Switzerland’s gold imports in March came from 4 sources, with the UK (London) leading the way, accounting for 25.6 tonnes, followed by Hong Kong (22.4 tonnes), UAE – Dubai (22.1 tonnes), and the US (13.9 tonnes). These 4 countries were also, and in this order, the largest suppliers of gold to Switzerland during February and January.
Hong Kong and Dubai have now become key suppliers of gold to the Swiss, so it will interesting to see how long this trend lasts and if it will reverse anytime soon. Hong Kong also had the distinction in March of sending nearly as much gold to Switzerland as it received from Switzerland, i.e. a strong two-way flow. See below for Hong Kong’s gold exports.
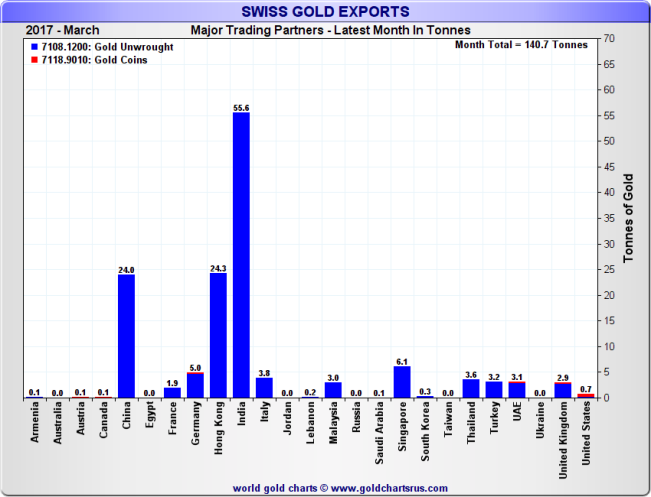
On the gold export side, India was the standout destination for Swiss non-monetary gold exports in March, taking in 55.6 tonnes. Neck and neck in 2nd and 3rd places were Hong Kong (24.3 tonnes) and China (24 tonnes). Together, India, China and Hong Kong took in 103.9 tonnes of gold, or nearly 75% of Swiss gold exports during March. India has now been the leading importer of gold from Switzerland for every month in the first quarter, and has imported a cumulative 119.2 tonnes of Swiss gold in Q1.
The UK (more correctly the London Gold Market) continues to be a supplier to gold to Switzerland, a trend which most recently began last October. From October 2016 to March 2017, London has supplied a cumulative 325 tonnes of gold to the Swiss gold sector, of which 140 tonnes was in Q1 2017.
The Bank of England has now begun to release monthly data on the quantity of gold held in its gold vaults in London. This data is released on a 3 month lagged basis. See BullionStar blog “Bank of England releases new data on its gold vault holdings” for full details.
Since bullion banks and central banks hold gold in the Bank of England vaults, it should be possible to begin comparing fluctuations in Bank of England gold vault holdings against UK gold exports to and imports from Switzerland for the simple reason that bullion bank non-monetary gold transactions in theory will affect both sets of data.
COMEX – Vaulted gold in New York COMEX vaults
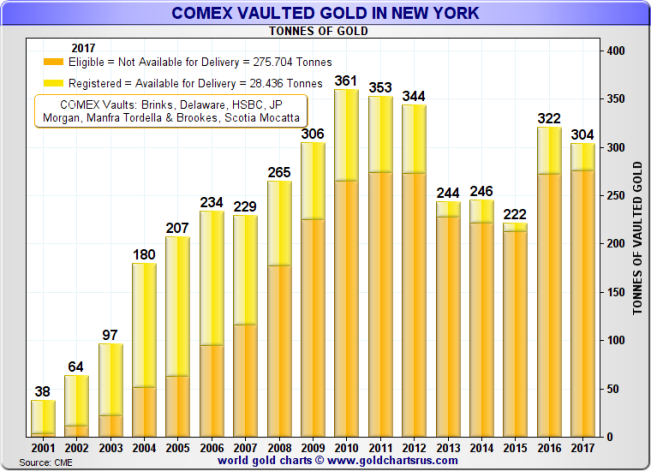
As of the end of April, the series of gold vaults in and around New York City that are part of the COMEX approved vaulting network for COMEX gold futures trading held a relatively low 28.4 tonnes of gold in the “Registered" reporting category, and a further 275.7 tonnes in the “Eligible" category.
As a reminder, “Registered" gold is gold (100 oz bars and kilo bars) for which a warrant (document of title) has been issued by a precious metals vault facility in satisfaction of delivery of a gold futures contract. “Eligible gold" is all the gold (excluding Registered gold) that is residing in a COMEX approved vault and which is acceptable by the COMEX for delivery against gold futures contracts.
Popular Blog Posts by Gold Market Charts
 November 2018 Gold Market Charts
 May 2018 Gold Market Charts
 December 2017 Gold Market Charts
 November 2017 Gold Market Charts
 October 2017 Gold Market Charts
 September 2017 Gold Market Charts
 August 2017 Gold Market Charts
 July 2017 Gold Market Charts
 June 2017 Gold Market Charts
 May 2017 Gold Market Charts


 Gold Market Charts
 2 Comments


