February 2017 Gold Market Charts
Gold market charts is a recent addition to the BullionStar research offering. Using charts as a central focus, each month we explore the evolution of a chosen set of charts so as to highlight key developments in gold demand, supply and physical movement data across the world’s major gold markets. The charts presented are created by the unique GOLD CHARTS R US website and they include Russian gold reserve changes, Chinese and Indian gold demand, and Swiss gold trade flow statistics.
BullionStar’s website also features BullionStar’s own gold and silver price charts under the BullionStar Charts menu, where, for example, you can measure stock indices and currencies in terms of gold and other precious metals.
Shanghai Gold Exchange (SGE) – Gold Withdrawals
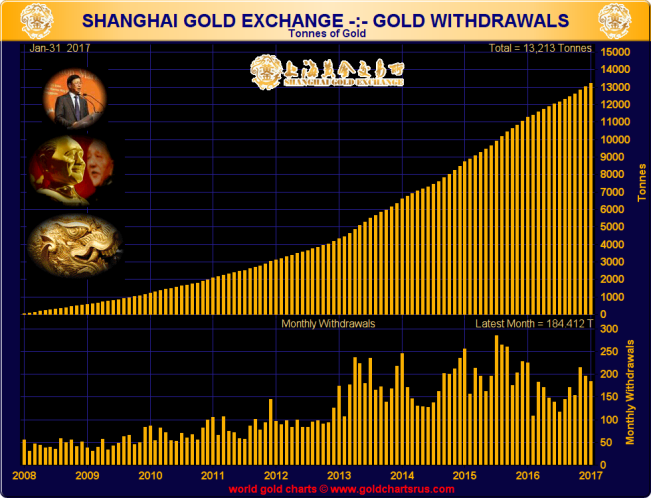
Physical gold withdrawals from the Shanghai Gold Exchange in January 2017 totalled 184 tonnes. This was 18% lower than January 2016 SGE gold withdrawals of 225 tonnes, but there were less trading days in January 2017 for Chinese financial markets due to the Chinese New Year and Golden Week holidays falling within the tail end of January this year compared to having fallen in the second week of February last year.
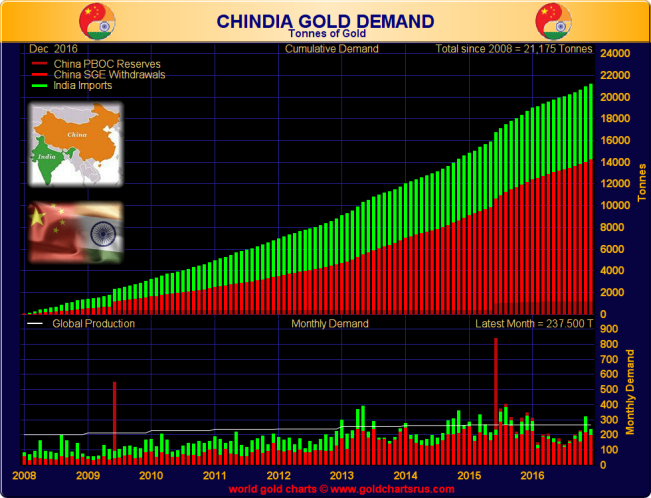
Gold withdrawals from the Shanghai Gold Exchange are arguably a good proxy for overall Chinese wholesale gold demand (excluding monetary gold demand by the Chinese central bank). On a cumulative basis, SGE gold withdrawals have now reached 13,213 tonnes since the beginning of 2008, which is on average over 1450 tonnes of gold per year.
Chinese and Indian Gold Demand
Adding together Shanghai Gold Exchange physical gold withdrawals, Chinese central bank gold holdings, and Indian physical gold imports, gives a workable proxy for combined Chinese and Indian gold demand, i.e. physical gold demand from the world’s two major gold powerhouses, most of which is supplied by or passes through such nations as Switzerland, the UK, the US, Australia, and South Africa.
Through to the end of December 2016, cumulative total gold tonnage for SGE gold withdrawals, Chinese central bank gold holdings, and Indian gold imports was 21,175 tonnes compared to 20,938 tonnes at the end of November 2016.
Russian Gold Reserves
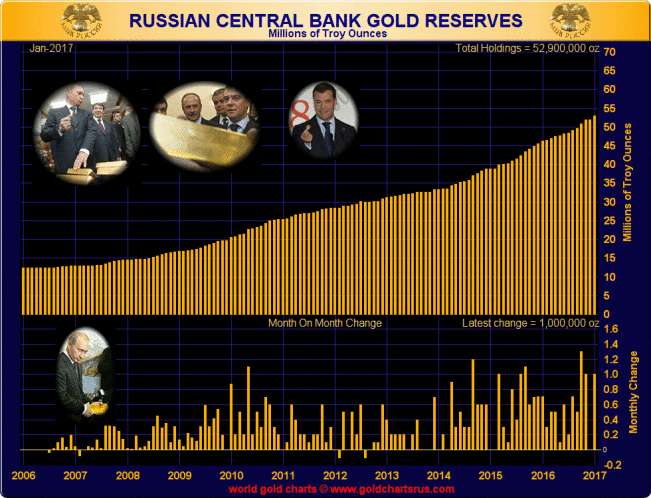
The Bank of Russia added a massive 1 million ounces (31.1 tonnes) of monetary gold to its foreign exchange and gold reserves during January, thereby signalling a strong start to its 2017 gold accumulation strategy. The January increase was on a par with a similar increase of 1 million ounces which the central bank made in November 2016.
The Russian central bank accumulates its gold via purchases from large Russian commercial banks, who in turn source the metal via agreements with Russian gold mining companies. The Russian Federation, through the Bank of Russia, now holds 1645 tonnes of gold. After adding 200 tonnes to its gold reserves in 2016, the evolution of Russian monetary gold reserves during 2017 is a key theme to watch.
Transparent Gold Holdings – ETFs and Others
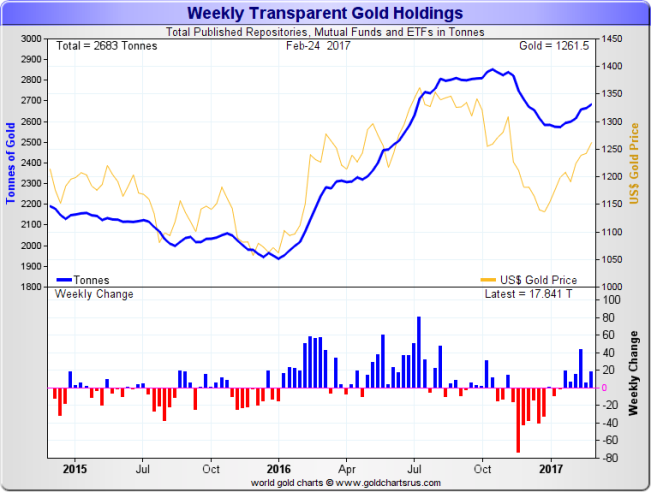
The trend established in January of sustained increases in the gold holdings of gold-backed ETFs and similar vehicles has persisted into February, with registered holdings of the vehicles under coverage continuing to increase. As of 24 February, the combined gold holdings of the products and platforms in the below chart stood at 2,683 tonnes. The January – February period now represents the longest cumulative inflow of metal into these vehicles since mid-2016.
Swiss Gold Imports and Gold Exports
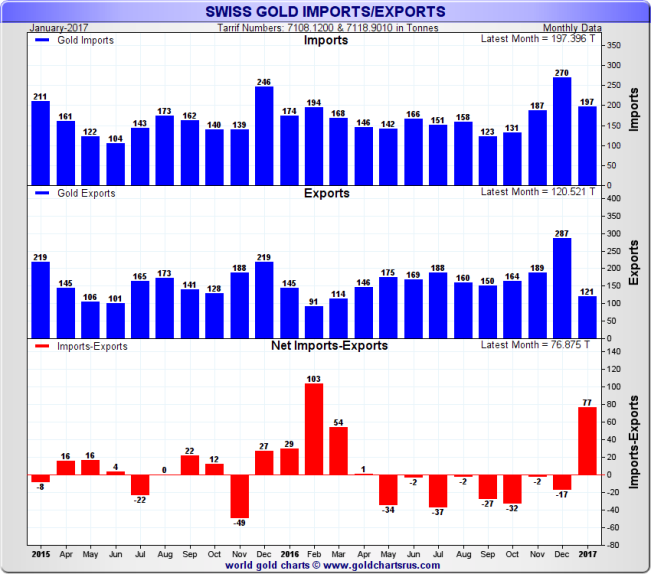
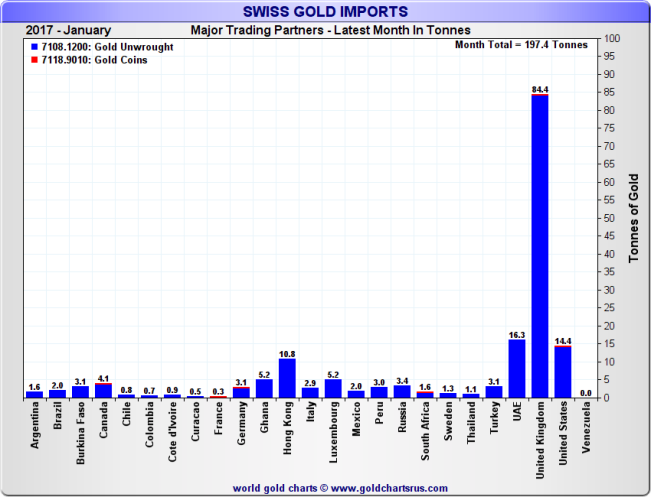
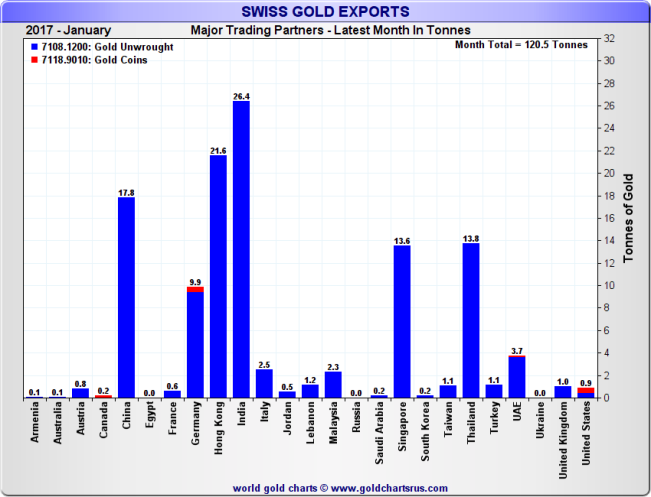
Imports of non-monetary gold into Switzerland totalled 197 tonnes in January, a figure which exceeded all other months of 2016 apart from December. Exports of non-monetary gold from the Swiss economy were more subdued, totalling only 121 tonnes, one of the lowest monthly export totals over the last 2 years. These gold flows produced a net gold import total of 77 tonnes for January, and adds to the pipeline of physical gold flowing into the world’s busiest gold refining center.
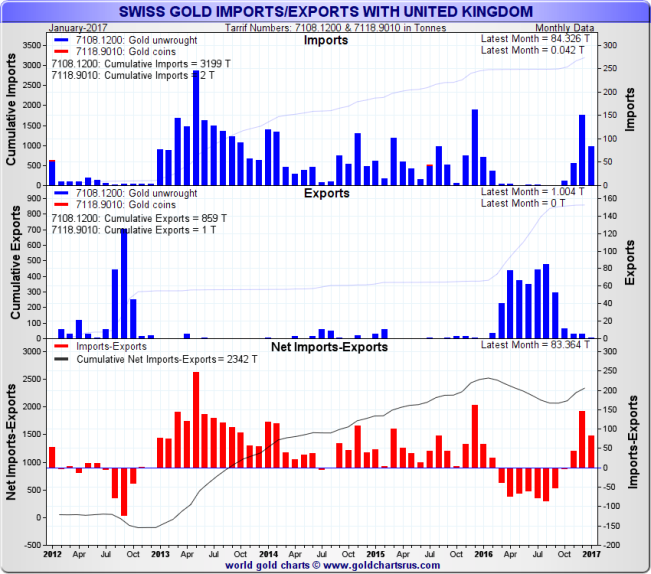
The UK (London) was again the dominant source of supply of non-monetary gold flowing into Switzerland in January, supplying 84 tonnes across Swiss borders, or 43% of total gold imports. Other notable suppliers were the US, UAE (Dubai) and Hong Kong.
On the export side, Asian destinations dominated in January with the bulk of Swiss gold exports being sent to India, Hong Kong, China, Singapore and Thailand, in that order. Together these 5 markets accounted for 77% of Switzerland’s January gold exports. The German market was a distant sixth place.
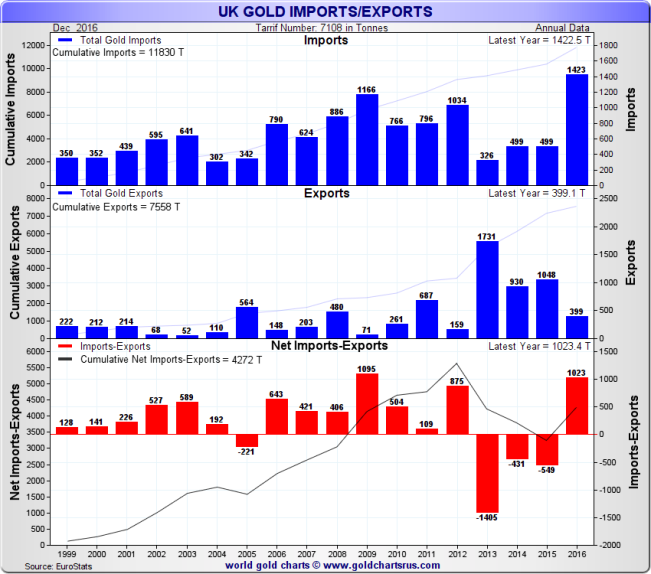
After importing 150 tonnes of non-monetary gold from the UK (London) in December 2016, and 48 tonnes in November 2016, the Swiss economy continued the trend by importing 84 tonnes of gold from the UK (London) in January 2017. However, this emerging pattern is a shift from primary trend in 2016 which saw London importing gold from Switzerland for most of 2016. In fact, given that full year UK gold import / export statistics for 2016 are now available, this month we feature an extra chart highlighting total UK gold imports and exports during 2016 (in tonnes).
Using Eurostat data, full year non-monetary gold imports into the UK in 2016 reached a massive 1423 tonnes. This was a multi-year high compared to the previous 15 years and suggests that London gold stocks required restocking during 2016 after the significant gold outflows (exports) from London over the 3 year period 2013-2015. These huge gold imports happened in the presence of relatively low total gold exports out of the UK (relative to 2013-2015), creating a very large net import figure for 2016.
Popular Blog Posts by Gold Market Charts
 November 2018 Gold Market Charts
 May 2018 Gold Market Charts
 December 2017 Gold Market Charts
 November 2017 Gold Market Charts
 October 2017 Gold Market Charts
 September 2017 Gold Market Charts
 August 2017 Gold Market Charts
 July 2017 Gold Market Charts
 June 2017 Gold Market Charts
 May 2017 Gold Market Charts


 Gold Market Charts
 0 Comments