Biggest Economic Power Shift In Decades
2013 is the year wherein unprecedented amounts of physical gold are distributed from west to east; a shift in wealth and power not seen in decades. An overview, based on trade data from January till August, of the gold routes to China:
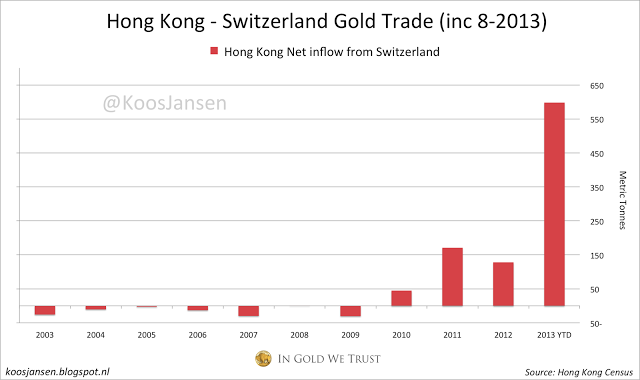
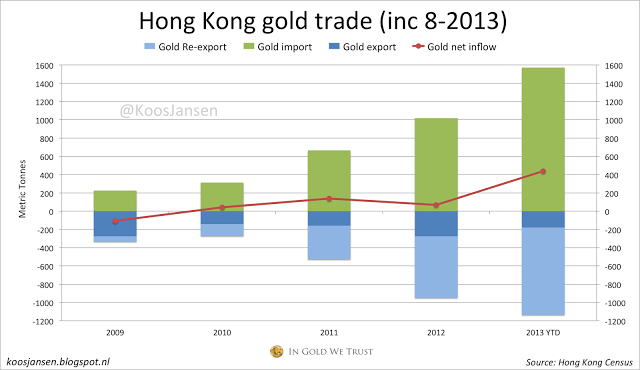
The Hong Kong Census and Statistics Department does give us detailed information about their gold trade. Net import from the Swiss has exploded this year, standing at 598 tons year to date.
Other major suppliers to Hong Kong are Australia (106 tons), the US (117 tons) and South Africa (114 tons). Although a quite significant portion of this gold stays in Hong Kong, the bulk of it is brought across the border to the mainland.
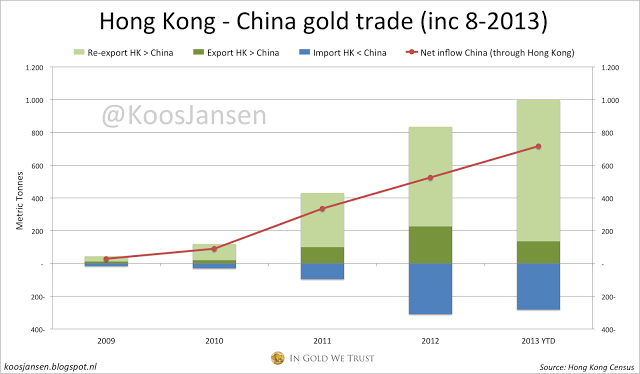
Up until August China mainland has net imported 717 tons of gold from Hong Kong. Is that all? No.
Recently I’ve found out that physical delivery at the Shanghai Gold Exchange equals total Chinese gold demand (click here to read my research). And because demand must equal supply, supply must equal SGE delivery.
Gold supply consists of three categories; mine, scrap and import. Total SGE delivery in the first 8 months of 2013 was 1499 tons, so domestic mine production plus scrap plus import should equal 1499 tons. Chinese mine production is estimated to be 400 tons by year end, this would be 266 tons in 8 months. In 2011 Chinese scrap supply was 400 tons. It will be far lower this year because of a lower gold price. Lets say scrap will be 300 tons by year end, this would be 200 tons in 8 months. A quick sum tells us how much total Chinese gold import in the first 8 months of 2013 must have been.
SGE delivery = total supply = mine + scrap + import
And thus;
SGE delivery – scrap – mine = import
1499 – 200 – 266 = 1033
Total import must have been 1033 tons, import from Hong Kong was 717 tons which leaves a gap of 316 tons. Concluding that China has net imported, from January till August, 316 tons of gold through other ports than Hong Kong. This could have come from COMEX inventory or from Chinese overseas mines, who knows..
Popular Blog Posts by Koos Jansen
 China’s Secret Gold Supplier is Singapore
 Audits of U.S. Monetary Gold Severely Lack Credibility
 China Gold Import Jan-Sep 797t. Who’s Supplying?
 The Gold-Backed-Oil-Yuan Futures Contract Myth
 Estimated Chinese Gold Reserves Surpass 20,000t
 Did the Dutch Central Bank Lie About Its Gold Bar List?
 PBOC Gold Purchases: Separating Facts from Speculation
 U.S. Mint Releases New Fort Knox Audit Documentation
 China Net Imported 1,300t of Gold in 2016
 Why SGE Withdrawals Equal Chinese Gold Demand and Why Not


 Koos Jansen