Week 42 SGE Physical Delivery and Its True Context
When I speak of physical delivery at the Shanghai Gold Exchange (SGE), I mean gold that is withdrawn from the vaults – the SGE is an exceptional exchange because it publishes these numbers. Technically, “Delivery" is a misnomer by me (and the SGE). On all other futures exchanges “delivery" actually means the amount of gold in the vaults that changes ownership after settlement between short and long contracts. “Delivery" happens in the vault, it tells us not much about the amount that’s being withdrawn. SGE delivery does tell how much is withdrawn, and gives u great insight in Chinese overal gold demand.
On the SGE the amount of gold withdrawn from the vaults in this first 9 months of 2013 was 1672 tons (second number from the right 本年累计交割量 is gold withdrawn YTD).
The SGE doesn’t publish – that I’m aware of – the amount of gold in the vault at any certain time. It does publish the amount of withdrawals every week, and total deposits at the end of a year. This is the SGE summary of 2011.
An exceptional rule on the SGE is that all bars that leave the vaults are not aloud to come back in. I know, hard to believe, but this rule is in their rule book, it’s mentioned on the ICBC website, the SGE confirmed this to me on the phone and my contact in China confirmed it (what more can I do?). On top of this, mine and import supply in China are required to be sold over the SGE. The result is that the gold that leaves the SGE vaults reflects total supply, and thus demand.
The confusion about the differences between SGE and COMEX delivery is caused by the SGE who is somewhat inconsistent in its choice of words, or maybe its translations. I hope the difference in delivery at the SGE and COMEX is clear now.
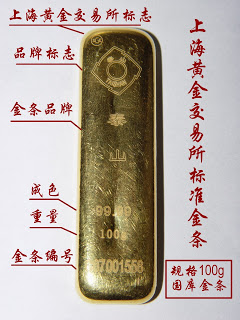 |
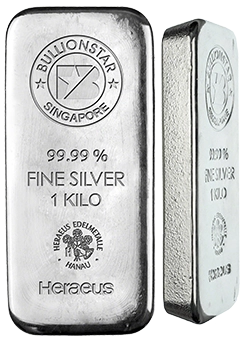
| SGE 100 gram gold bar |
1. 上海黄金交易所标准金条 Shanghai Gold Exchange Standard Gold Bar.
Now let’s turn to last weeks SGE delivery (withdraws from the SGE vaults) data.
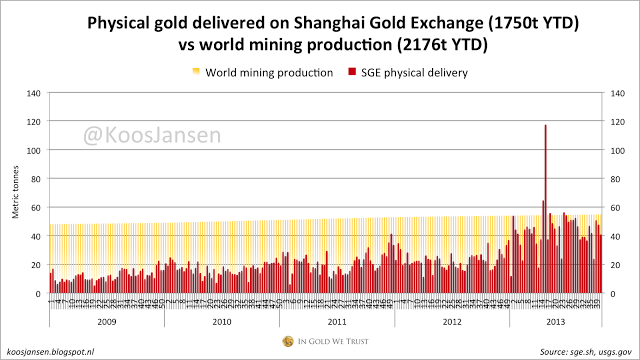
– 41 metric tonnes delivered in week 42 (withdraws from the SGE vaults), 14-10-2013/18-10-2013
– w/w – 14.47 %
– 1750 metric tonnes delivered year to date
– weekly average 41.6 tonnes YTD, 2013 estimate yearly total 2125 tonnes.
Source: SGE, USGS
For more information on SGE delivery read this, on it’s relation to Chinese gold demand read this.
Screen dump from SGE trade report; the second number from the left (本周交割量) is weekly physical delivery, the second number from the right (累计交割量) is total delivery YTD.
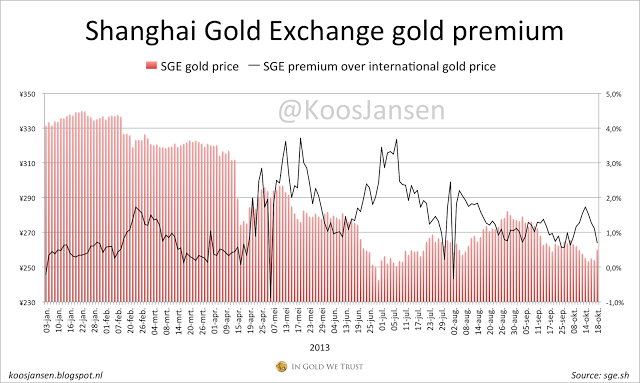
Premiums based on the SGE week reports. Difference between SGE gold price in yuan and international gold price in yuan.
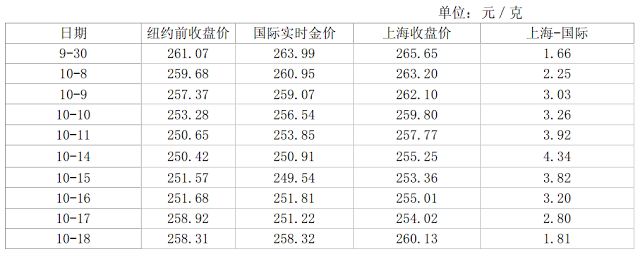
Screen dump of premium section; the first column is the date, the third the international gold price in yuan, the fourth is the SGE price, and the last is the difference.
O, one more thing. While Chinese demand for physical gold is still insatiable, this is what the CME just published.
Jewelry Demand Sluggish from India and China
India and China are the largest buyers of gold for jewelry in the world. India has been worried about its negative balance of trade and has been raising tariffs on gold imports to slow demand. And while for different reasons, both India and China have been in a growth deceleration period, which has also slowed the demand for gold. Absent a sustained period of accelerating economic growth, demand for gold from India and China is likely to remain much more subdued than it was in the previous decade, when they helped to drive the bull market for gold.
Popular Blog Posts by Koos Jansen
 China’s Secret Gold Supplier is Singapore
 Audits of U.S. Monetary Gold Severely Lack Credibility
 China Gold Import Jan-Sep 797t. Who’s Supplying?
 The Gold-Backed-Oil-Yuan Futures Contract Myth
 Estimated Chinese Gold Reserves Surpass 20,000t
 Did the Dutch Central Bank Lie About Its Gold Bar List?
 PBOC Gold Purchases: Separating Facts from Speculation
 U.S. Mint Releases New Fort Knox Audit Documentation
 China Net Imported 1,300t of Gold in 2016
 Why SGE Withdrawals Equal Chinese Gold Demand and Why Not


 Koos Jansen

