Weekly Chinese Gold Demand Exceeds Global Mining Production
All over the media we have seen extreme gold shopping sprees around new year and at the Lunar year in China. This resulted in an all time Chinese gold demand record in January – which accounted for 246 tons. In the screen shot below the second number from the right (green – 本年累计交割量) is the amount of gold withdrawn form the SGE vaults in January in Kg.
Below a video from Chinese state TV network CCTV on the gold buying spree around the Lunar Year. Although I didn’t manage to produce subtitles (working on it!), I think the images speak for themselves.
Who thought this gold rush would come down anytime soon is wrong. It seems the Chinese are in a state to buy all the physical gold that can be supplied. The beauty of internet is that I have a lot of sources in the mainland, and Chinese that live in other parts of the world, that sent me regular updates on what’s happening in Chinese jewelry stores, in the paper gold market, on the SGE and in the Chinese media if they happen to stumble on something newsworthy. Yi Zhang lives in San Fransisco and sent me an email on February 15, 2014:
Hi Koos, these two photos were taken yesterday by my uncle in a gold shop in Beijing. “People are buying gold like groceries" – he told me in Chinese.
Regards,
Yi


I the first have of February the Chinese have been very aggressive buyers. Can it be these people are fully aware of the dangers of credit bubbles and gold’s function as a store of value and a protection against potential implosions?
“We often get depositors coming in asking if the bank could go bust" – P.Daily calms nerves on #China #bank failures. http://t.co/SOXM3sMuvY
— John Sinclair Foley (@johnsfoley) February 14, 2014
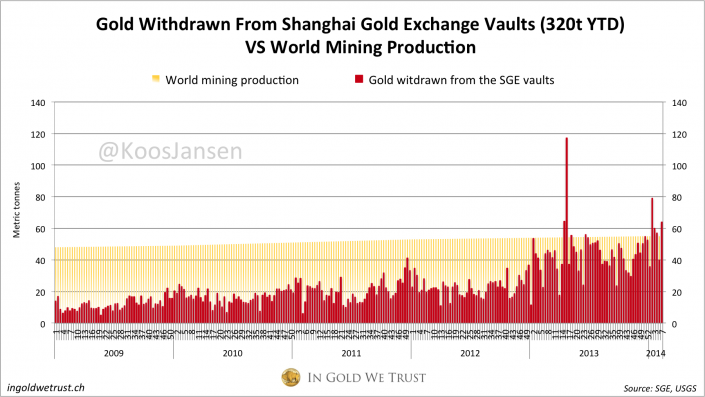
Overview Shanghai Gold Exchange data 2014 week 7
– 64 metric tons withdrawn in week 7 (10-02-2014/14-02-2014)
– w/w + 60.26 %
– 320 metric tons withdrawn year to date
My research indicates that SGE withdrawals equal total Chinese gold demand. For more information read this, this, this and this.
This is a screen shot from the weekly Chinese SGE trade report; the second number from the left (blue – 本周交割量) is weekly gold withdrawn from the vaults in Kg, the second number from the right (green – 累计交割量) is the total YTD.

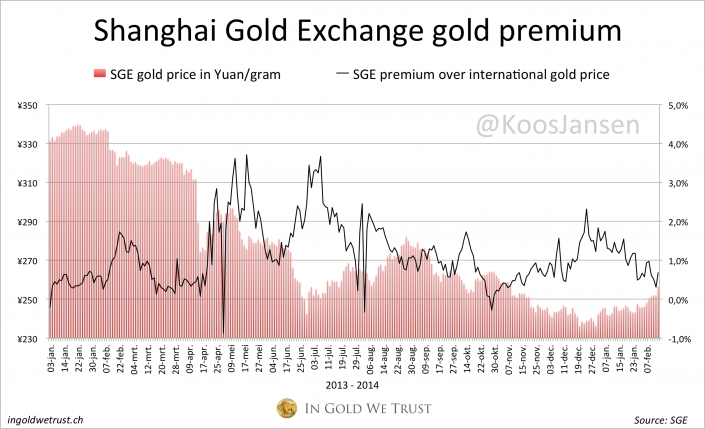
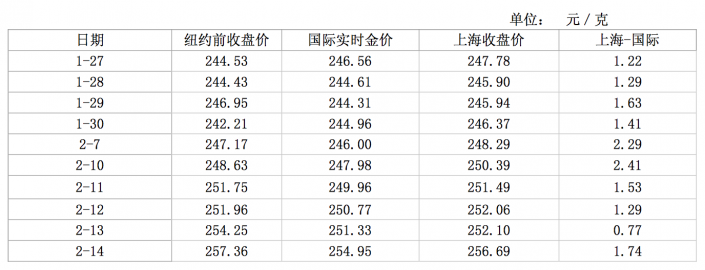
This chart shows SGE gold premiums based on data from the SGE weekly reports (it’s the difference between the SGE gold price in yuan and the international gold price in yuan).
Below is a screen shot of the premium section of the SGE weekly report; the first column is the date, the third is the international gold price in yuan, the fourth is the SGE price in yuan, and the last is the difference.
In Gold We Trust
Popular Blog Posts by Koos Jansen
 China’s Secret Gold Supplier is Singapore
 Audits of U.S. Monetary Gold Severely Lack Credibility
 China Gold Import Jan-Sep 797t. Who’s Supplying?
 The Gold-Backed-Oil-Yuan Futures Contract Myth
 Estimated Chinese Gold Reserves Surpass 20,000t
 Did the Dutch Central Bank Lie About Its Gold Bar List?
 PBOC Gold Purchases: Separating Facts from Speculation
 U.S. Mint Releases New Fort Knox Audit Documentation
 China Net Imported 1,300t of Gold in 2016
 Why SGE Withdrawals Equal Chinese Gold Demand and Why Not


 Koos Jansen

