
A Silent Gold Revolution: The New Gold Price Breakout

 Ronan Manly
 0 Comments
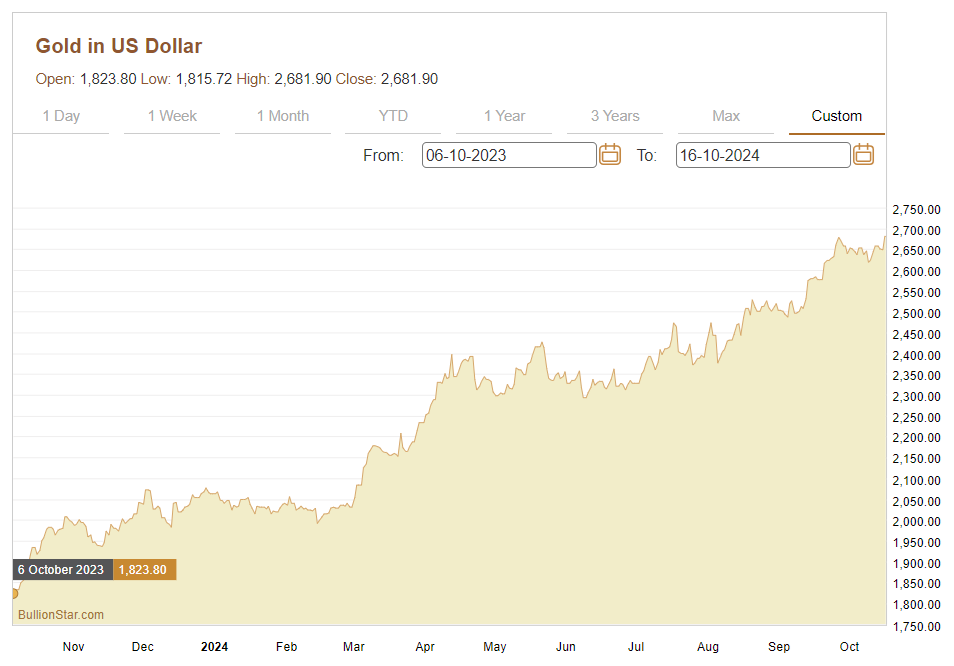
One of the standout trends in financial markets this year has been the rapid appreciation in the international gold price to consistent new all-time highs above US$ 2680. Year-to-date, the USD spot price of gold is up 30% at $2681 at the time of writing, with most of this increase occurring over a seven and a half month period since early March after the price broke out of a trading range just above US$ 2000.
Even if this year-to-date performance is maintained and the price stays where it is now, it would mean that 2024 will record the best annual calendar year gold price return since 2007 (when the gold price rose by 30.9%), and would be the second best performing year since the new millennium.
The US dollar gold price is also now up an astonishing 47.7% since 6 October 2023 when it lingered around the $1815 mark. What a difference a year makes!
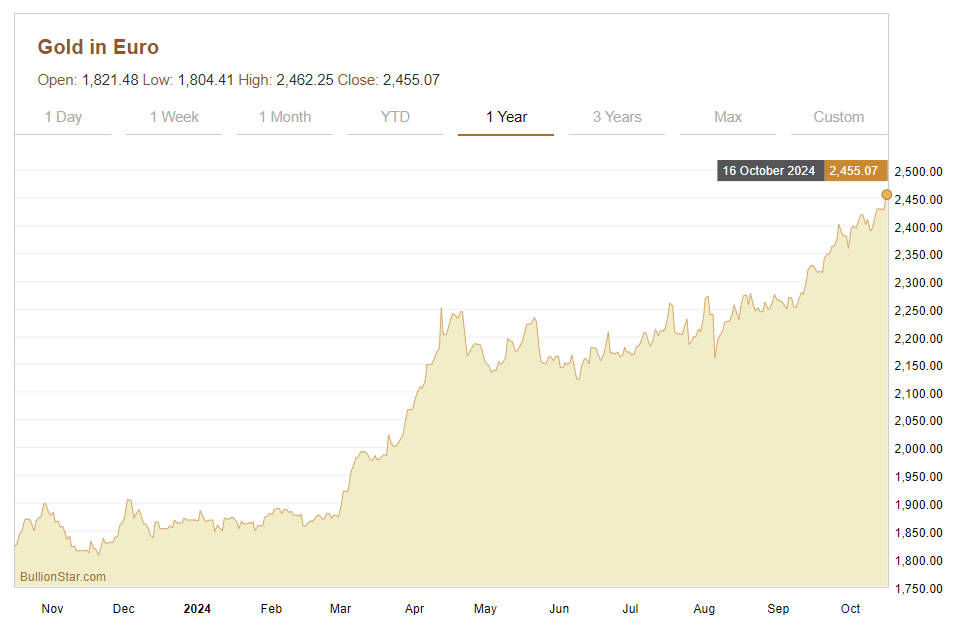
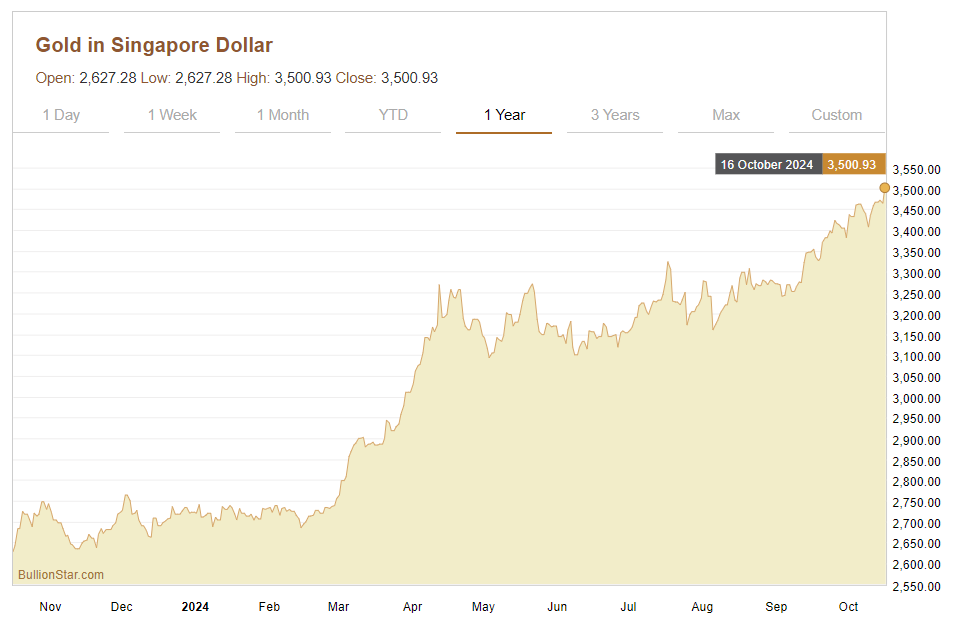
Not only has the gold price broken out to all-time highs in US dollar terms, it has also broken out to all-time highs in every major fiat currency, including the Euro, British pound, Japanese yen, Chinese yuan, Swiss franc, Australian dollar, Singapore dollar, Hong Kong dollar and Canadian dollar.
The rapidity of the gold price rise since March 2024 has also been astounding, with the price surge having been driven by a combination of factors which have led investors to seek out gold as a safe haven, as a store of value and as an inflation hedge:
• Geopolitical uncertainty and conflict (particularly from conflicts in Ukraine/Russia and the Middle East)
• A monetary policy shift by the Federal Reserve and other central banks from interest rate tightening to an interest rate cutting cycle
• Increased inflation expectations and currency debasement fears
• Concerns over renewed quantitative easing, accelerating money supply growth, and an ever growing US federal debt
Additionally, due to the expectation of higher gold prices and the resulting momentum, the gold price has seen speculative trading activity on derivatives exchanges in China (the Shanghai Futures Exchange – SHFE) and on the COMEX.
De-dollarisation themes are also becoming influential in shaping investors’ perceptions of gold due to speculation about gold’s role in a future BRICS monetary system, as well as the continual moves by central banks to increase the gold component of their reserve assets, given that physical gold held in their own vaults has no counterparty risk or sanctions risk.
More and more participants in the global financial markets are thus flocking to obtain exposure to the gold price, so as to benefit from the perennial safe haven and store of value attributes which gold provides, and as a form of financial insurance and wealth preservation.
An Under-the-Radar Move
However, this gold bull move is still in some ways an under-the-radar stealth rally, and has arguably not yet gained universal investor attention.
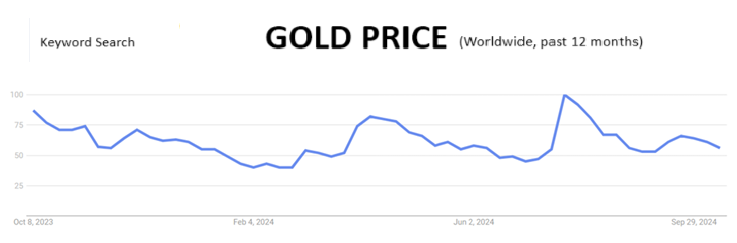
Interestingly, on a worldwide basis, the search term ‘Gold Price’ in Google Trends has actually been falling since it peaked at ‘100’ during the last week of July, and is now at ‘69’, which is even below a secondary peak which was recorded in mid April 2024 (which had a value of ‘82’). In fact, in terms of search frequency, ‘Gold Price’ as a keyword search term is now below levels recorded in early December 2023 (when it recorded a value of ‘71’).
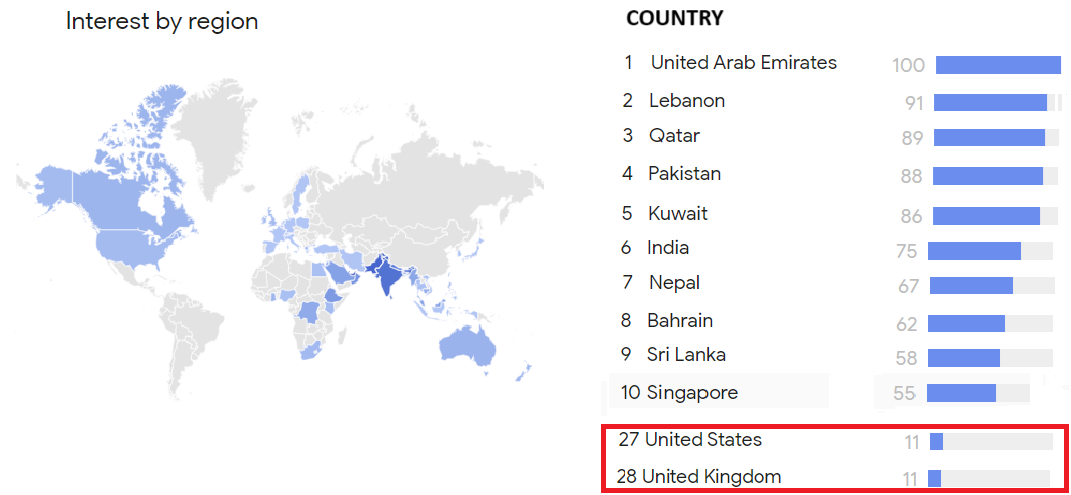
On a country basis, the countries recording the highest search interest in ‘Gold Price’ are, not surprisingly, countries in the Middle East and South Asia / South East Asia, such as the United Arab Emirates (with a perfect score of ‘100’), Lebanon (with a score of ‘91’), Qatar (‘89’), Kuwait (‘86’), and India (‘75’). These very high scores are due to these countries either being gold trading hubs, and/or countries with traditional keen interest in gold, as well as arguably a geopolitical risk premium due to the conflicts in the Middle East.
Notably, interest in the search term ‘Gold Price’ is still anemic in the US and UK, with each having a paltry score of ‘11’ a piece, which is a useful metric showing that interest in gold in these Western nations is still nothing like a frenzy and has not been picked up by the mainstream investment community.
Rapid Gold Price Appreciation
There have only been a handful of times since 2000 where the gold price has risen with such rapidity over such as short period, and the March – October 2024 period is one of them.
The other time periods included September 2007 – March 2008 (the global financial crisis as major financial institutions collapsed), August 2010 – March 2011 (accelerated quantitative easing globally), February – August 2011 (European debt crisis and US credit rating downgrade), June 2019 – February 2020 (China – US trade wars and the beginning of US interest rate cuts), and March – August 2020 (Covid lockdowns and global stimulus).
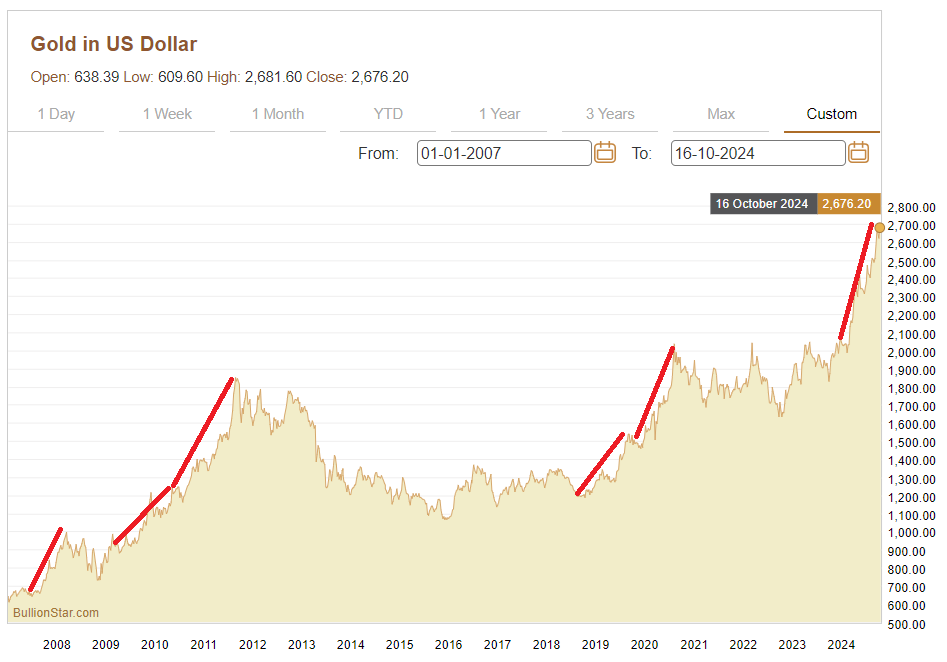
But whereas in many of those time periods, the rising gold price was signalling a reaction to a specific economic event that was bounded by time, the gold price bull market of 2024 is different because it is based on a broad range of drivers and concerns that are unbounded by time. That is why the current gold price rally could have staying power.
All-Time-Highs in all Major Currencies
Another key trait of the gold price rally of 2024 is that it has created consistent new all time highs for the gold price in all major fiat currencies. Whichever major fiat currency you pick, the gold price has been making new all-time highs in that currency, a fact which highlights that this gold price bull market is not based on US dollar weakness.
For example, in Euro terms, the gold price has this week made an all time high above €2,455 per oz, and is up by more than €575 since the end of February, a fact which will not have gone unnoticed by the European Central Bank (ECB), nor by the millions of physical gold buyers all across Germany and the rest of the Eurozone.
The Singapore dollar gold price has added nearly SGD 750 since late February and this week hit a new all time high above SGD 3500, a development which will be welcomed by BullionStar’s extensive customer base in Singapore and South East Asia.
From looking at the US Dollar Index (DXY), it is evident that all of these continual new all-time highs in the gold price across multiple major fiat currencies during 2024 are not due to US dollar weakness, because during some of 2024 bull run the gold price in US dollar terms has been increasing while the US dollar has been strengthening, for example during March-April, and again during the first two weeks of October.
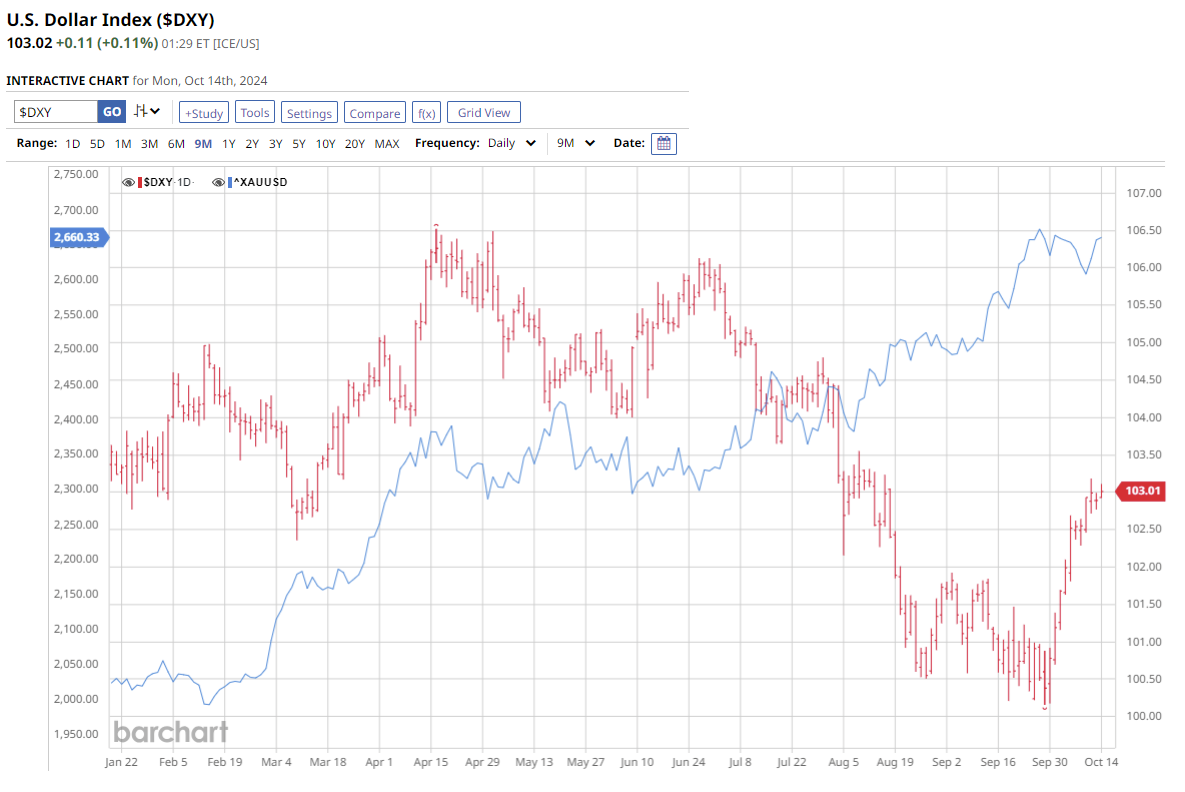
The US Dollar Index (DXY) measures the value of the US dollar relative to a weighted basket of the Euro, Japanese yen, British pound, Canadian dollar, Swedish krona, and Swiss franc, The DXY rises when the US dollar strengthens vs the component currencies, and vice versa.
US and Global Interest Rate Cuts
A recent shift in the US and other major central banks’ official interest rate policies to interest rate cutting cycles has also had a substantial impact on the recent strength of the gold price.
The most influential shift in interest rate policy has come from the US, whereon 18 September, the US Federal Reserve’s FOMC cut the US benchmark interest rate by a sizeable 0.5% to a range of 4.75% – 5.00%, citing a taming inflation while conceding that the US unemployment rate is too high.
This was the first US Fed interest in over 4 years (since March 2020), and so it is highly significant. It was a larger cut than the market had been expecting. For example, one week before the FOMC announcement, the market (based on the CME FedWatch tool) had been pricing in a 73% probability of a 25 basis points cut vs a 27% probability of a 50 basis point cut.
The FOMC’s 19 members also signalled via their dot-plot predictions that there will be another 0.5% reduction in US benchmark interest rates by the end of 2024, which can be announced in one or both of the remaining FOMC meetings scheduled for this year, 6-7 November and 17-18 December.
At the time of writing, the CME FedWatch tool (which uses the pricing of 30-day Fed Fund Futures contracts) was signalling that for the November FOMC meeting, there is a 84% probability of a 0.25% cut and a 16% probability of no cut (with another rate cut implicitly put back to December).
Financial markets therefore now have more belief that the rate cuts that have started in September are the beginning of a US interest rate cutting cycle. Which again is all good for the gold price and explains some of the recent gold price appreciation.
Other major economic areas have also begun interest rate cutting cycles with the European Central Bank (ECB) beginning a new cycle of interest rate cuts in June (citing that inflation was under control) and cutting the ECB deposit rate from 4% to 3.75%. This was followed up in September by another 0.25% cut, bringing the deposit rate to 3.5%. A third interest rate cut is expected by the ECB later this week.
In the UK, the Bank of England, for the first time since March 2020, cut its benchmark interest rate from 5.25% to 5% in August, and the Bank of England governor Andrew Bailey now says that UK interest rate cuts should be more aggressive. This too means the UK is set to embark on a rate cutting cycle, all of which is gold positive.
In China, authorities are also busy cutting interest rates and flooding the economy with liquidity in an attempt to boost China’s ailing economy. In late September, the Chinese central bank announced a series of interest rate cuts and bank liquidity measures, and even more recently, the Chinese government announced massive fiscal stimulus of over $300 billion last week targeted at jump starting China’s faltering property and consumer sectors.
With the world’s major central banks now embarking on interest rate cutting cycles and economic stimulus, markets see this as gold positive, taking the view that lower interest rates reduce the opportunity cost of holding “non-yielding” gold. However, there is a more important component here and that is inflation expectations.
While central banks claim that they are now cutting interest rates due to having succeeded in bringing inflation down, this looks like a smokescreen to conceal the fact they they are primarily cutting rates because of increased concerns about the risk of economic downturn and/or recession.
So in essence, central banks are now walking a fine line between juicing up economic growth and keeping inflation under control while preventing stagflation (simultaneous economic stagnation and inflation). But given that the gold price continues to rise and given that gold acts as a hedge against future inflation, some of this gold price strength looks to be signalling renewed future inflation and that higher inflation expectations are on the horizon.
Debt and Money Supply Growth
The strengthening gold price is also a reflection of the unsustainable and rapidly deteriorating fiscal situations on both US and Global levels and rapidly expanding money supply metrics, all of which point to continued fiat currency debasement.
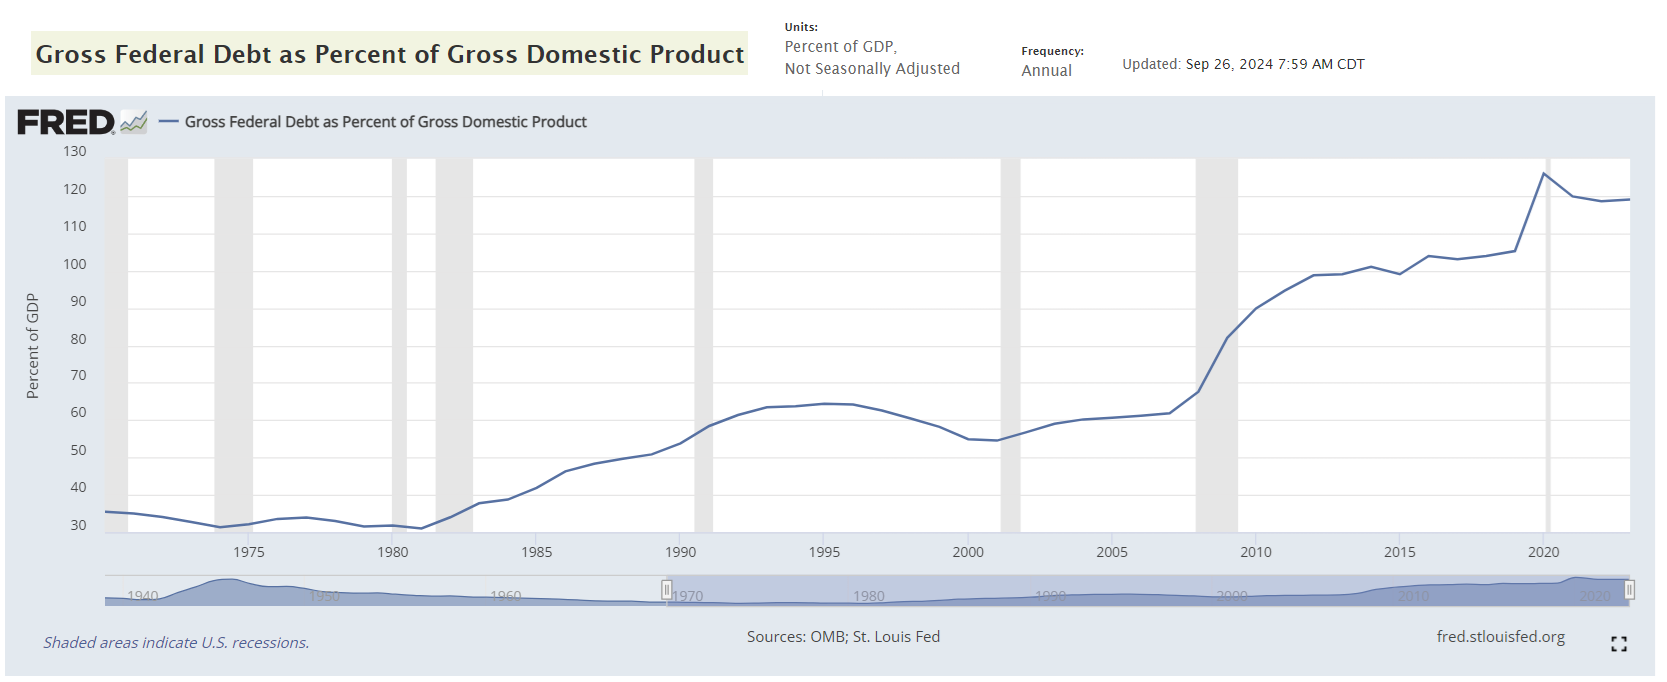
The US national debt (federal debt) continues to spin out of control and has now hit an unprecedented US$ 35.7 trillion, while the US federal debt to GDP ratio is now 124%. The US federal budget deficit is now at a staggering $ 2.2 trillion. See the USDebtClock here. And now, for the first time ever, interest payments on US federal debt have hit more than US$ 1 trillion per year.
This huge federal debt will at some point become unsustainable, and even now it has no chance of being reduced through tax increases or spending cuts, and its constant growth increases the risk of a US debt default at some point in the future, unless the US Government attempts to inflate the debt away by creating more inflation, a scenario which again is very gold positive.
Global debt levels are also increasingly concerning. According to the Institute of International Finance (IIF) Global Debt Monitor, total global debt (as of May 2024) reached a record US$ 315 trillion. And the International Monetary Fund (IMF) has just published it’s Fiscal Monitor for October 2024, saying that ‘global public debt’ (of governments) is expected to exceed US$100 trillion in 2024.
As well as the US, other major economies are showing extremely high debt-to-GDP ratios; such as Japan with a public debt to GDP ratio of 302%, Italy (174%), France (130%), Spain (136%) and the UK (110%). See World Debt Clock here.
Global Debt Hits a New High of $315 Trillion 💸
— Visual Capitalist (@VisualCap) August 23, 2024
📲 Want more content like this with daily insights from the world’s top creators? See it first on the @VoronoiApp.https://t.co/ThNsVM3QRN pic.twitter.com/SAxkLnKaQO
Global money supply is also accelerating rapidly due to central bank ‘money creation’ out of thin air, and is now over $107 trillion. Over the long term, as gold retains its purchasing power, the value of above ground gold will adjust to reflect this huge increase in fiat currency money supply.
However, with global debt of over $315 trillion, and global money supply of $107 trillion, the total market value of all above above ground gold is tiny in comparison at approximately US$ 18.42 trillion.
This $18.42 trillion is based on World Gold Council data, and is calculated as “total above-ground stock (end-2023)" of 212,600 tonnes + “estimated 2024 gold mine production" of 3600 tonnes = 216,200 tonnes * 32150.7 troy ozs per tonne * current gold price of $2650 per troy oz = US$ 18.42 trillion.
In other words, global debt is 17 times larger than the current market value of all known above ground gold inventories, and global M3 money supply is 5.8 times larger than the current market value of all known above ground gold inventories. For the total value of above ground gold to converge towards the dollar value of this unprecedented debt and money supply growth, the gold price therefore has a lot of catching up to do.
Global Money Supply hits all-time high of $107 Trillion pic.twitter.com/ArrFcaQPbU
— Win Smart, CFA (@WinfieldSmart) October 10, 2024
Inflation-Adjusted Prices of Gold
While there is a lot of excitement in the gold world due to ‘new all-time-highs‘ in the gold price, there is an important caveat to remember – these all time highs are only true in a nominal sense, and do not reflect cumulative inflation over time.
When you adjust the gold price by past inflation, be it the official US Consumer Price Inflation (CPI) data of the Bureau of Labor Statistics (BLS), or by the arguably far more realistic and higher inflation measurements produced by ShadowStats (i.e. the ShadowStats Alternate CPI (1980 Base)), the gold price is in fact far less than inflation-adjusted all time highs, and in the case of the ShadowStats measurement, a huge amount less than the inflation-adjusted high.
Adjusting for inflation by the current BLS US Consumer Price Index (CPI), the real all-time-high of the US dollar gold price was in January 1980 at US$ 3680 per troy ounce.
However, there is a widely held view that the CPI calculations of the US Bureau of Labor Statistics deliberately underestimate consumer price inflation. Apart from the evidence available to the person on the street that actual price increases (or real inflation) is far higher than the BLS says it is, there is a motivation for the US government (and all governments) to underestimate inflation rates so as to make economies appear healthy and so that inflation-linked government payouts such as pensions, social security, and inflation-linked debt will be minimised. Therefore the BLS (and all governments) constantly change the methodology of calculating official inflation so as to minimise the inflation rates
This is why alternative inflation rate providers such as ShadowStats, with its Alternate CPI have emerged to push back against this government manipulation and to provide more accurate inflation calculations.
Aa such, the “Alternate CPI" from ShadowStats is an estimate of inflation up until today as if it were calculated using the methodologies that the Bureau of Labor Statistics used in 1980 when they were less corrupted. As ShadowStats explains:
“The Alternate CPI reflects the CPI as if it were calculated using the methodologies in place in 1980.
In general terms, methodological shifts in government reporting have depressed reported inflation, moving the concept of the CPI away from being a measure of the cost of living needed to maintain a constant standard of living.”
ShadowStats also says that:
“The ShadowStats Alternative CPI-U measures are attempts at adjusting reported CPI-U inflation for the impact of methodological change of recent decades”
In an article explaining the Bureau of Labor Statistics flaws, Shadowstats also says that:
“the Consumer Price Index has been reconfigured since the early-1980s so as to understate inflation versus common experience”.
When adjusted using the Alternative CPI-U (which remember is just a former CPI methodology of the Bureau of Labor Statistics), the real inflation-adjusted all-time-high for the gold price is a massive US$ 29,170 per oz (based on the January 1980 nominal gold price high).
Under this revision, there is still an awful lot of room for the current gold price to rise (more than 11 fold) before it approaches the real 1980 BLS methodology inflation-adjusted all-time-high. Quite a staggering number to think about.
For more background about the methodologies used to create these charts, see BullionStar article “The Staggering levels of inflation-adjusted prices of gold and silver“.
ES >5800
— zerohedge (@zerohedge) October 4, 2024
China melting up
Japan melting up
US melting up
… as all central banks engage in coordinated, global easing pic.twitter.com/GIO49Jp0R5
Gold price fuelled by derivatives – Yes, as Always
Since the international gold price broke out and began earnestly moving above the $2000 trading range starting in March this year, various commentators in the London financial media have attempted to explain the rapid price rise, and have come round to the view that it has been gold derivatives, and not the physical gold market, which have been the driver behind price increases.
For example, in a 23 April Financial Times (FT) article written by Harry Dempsey and Cheng Leng, titled “Chinese speculators super-charge gold rally”, at which time the gold price had reached $2400, the FT stated its belief that Chinese speculators on the Shanghai Futures Exchange (SHFE) had played a significant role in driving this gold price rise.
This was, said the FT, due to “long gold positions held by futures traders on the SHFE”, positions which by then had surged almost 50% since late September 2023 to nearly 300,000 contracts (equivalent to 300 tonnes of gold), driven by what the FT put down to geopolitical tensions in the Middle East, and domestic Chinese crises in the property sector and stock market.
This speculative activity, says the FT, was led by Chinese futures trading companies such as Zhongcai Futures, Citic Futures and Guotai Junan Futures.
More recently on 26 September this year (by which time the gold price had reached $2670), Ross Norman CEO of Metals Daily (and formerly of Sharps Pixley, Credit Suisse and N.M. Rothschild) in an article titled “Gold – The derivatives tail wagging the golden dog?” , also subscribed to the Chinese specs theory, saying that from earlier this year “the Chinese specs stuck their oar in, buying on exchange and OTC forwards, futures and options. And they bought in massive size” either due to expectations of US Fed interest rate cuts or concerns over the Chinese property sector.
There was then a“second phase to the Chinese specs – and that is the US specs … they have joined the party late … with futures longs now at a near 4 year high”. Norman says that “the idea that the market is derivatives lead makes sense in many ways” given that the gold price still rose at the same time as official US inflation rates fell, the dollar rose and treasury yields rose.
While these observations from the FT and Ross Norman concede the role of gold derivatives in driving the gold price in these recent instances, they fail to highlight that the international gold price is always and only set by paper gold markets, and not by physical gold markets, a theme which BullionStar has been at the forefront of explaining for many years.
The gold price is established in derivatives markets, primarily the London OTC gold market, the COMEX paper gold futures market, and more recently the Chinese SHFE. The London OTC gold market being a venue where unallocated gold, which is a derivative and a form of synthetic gold or gold credit or fractionally backed gold, is traded. These are the price making venues.
Supply of and demand for physical gold plays no role in setting the international gold price. Physical gold transactions in all other gold markets (price takers) just inherit the gold prices that are discovered in these derivative gold trading markets (price makers).
See BullionStar article “What Sets the Gold Price – the Paper or Physical Market?” and BullionStar Gold University primer “Bullion Banking Mechanics”.
The gold price feeds that you see on your screen from CNBC, Bloomberg, Reuters etc are just feeds that take in ‘screen gold’ XAU/USD quotes based on the trading of LBMA bullion bank trading desks and the trading of interdealer brokers and dealers such as LBMA members TP ICAP, Marex Spectron, BGC Partners, GFI Group, Sucden Financial, and Triland Metals.
Central Banks buying does not move the Gold Price
Which brings us to an important point. Nearly all mainstream financial media commentators and many gold sector commentators still maintain that the gold price bull run is being driven by among other factors, central bank gold buying of physical gold. You will be familiar with many gold articles with titles such as “Gold driven to new high due to record central bank gold buying” etc.
But in reality, central banks do not want their gold buying transactions to influence the gold price. They want the opposite. That is why central banks buy and sell gold (and lease and swap gold) in secret in London, coordinated by the Bank of England and via the Bank for International Settlements (BIS) trading desk, where they net off buyers and sellers so as to minimise price impact. The Bank of England and BIS may even use a queueing or rationing system for physical gold, allowing some central banks to buy some gold from other central banks and then some from annual new supply / recycling. This would explain why only a handful of central banks ever seem to be buying gold in any one month.

No central bank wants the gold price to break out in an uncontrolled way, as they all want to protect their fiat currencies. Remember that gold to central bankers is like the sun to vampires. The secrecy around central bank gold transactions and the London gold lending market exists so that central bank gold transactions don’t affect the market price of gold.
Some may find it surprising that even the People’s Bank of China (PBoC) and the Central Bank of the Russian Federation are central bank members of the BIS, along with 61 other central banks.
China has even gone on record saying that it does not want to influence the gold price with its gold buying. In 2010 “an official from the China Gold Association (CGA)” told China Daily that:
“Contrary to much speculation China may not buy the International Monetary Fund’s (IMF) remaining 191.3 tons of gold which is up for sale as it does not want to upset the market.”
“It is not feasible for China to buy the IMF bullion, as any purchase or even intent to do so would trigger market speculation and volatility”.
Despite this denial, China is actually a prime candidate for having purchased this 191.3 tonnes of IMF gold back in 2010. That is why details on the IMF on-market sales of gold in 2010 remain ‘highly confidential’, and the IMF has decided “not to declassify these documents because of the sensitivity of the subject matter”. For details see BullionStar article “IMF Gold Sales: Where ‘Transparency’ Means ‘Secrecy’”.
Also in March 2013, Yi Gang, deputy governor of the Chinese central bank, provided further evidence that central banks do not want their gold buying to move the gold price:
“We will also take into consideration a stable gold market. If the Chinese government were to buy too much gold, gold prices would surge, a scenario that will hurt Chinese consumers. We can only invest about 1-2 percent of the foreign exchange reserves into gold because the market is too small”.
See BullionStar article “Chinese Central Bank Gold Guying – On a Need to Know Basis”.
BRICS 2024 Summit – Kazan
All eyes will also be on the upcoming 16th BRICS annual summit, which this year, due to Russia holding the BRICS Chairmanship, takes place between 22 – 24 October in the Russian city of Kazan.
Kazan is an historic city in the Republic of Tatarstan approximately 500 miles east of Moscow, and 1.5 hours flight time from Moscow.
The Huge BRICS summit in Russia’s Kazan is gearing up and will begin on Oct 22nd.
— Yunus Arslan (@yunus_arslan_ya) October 12, 2024
It’ll be attended by Presidents and Prime Minister’s from dozens of countries, including:
🇹🇷 President of Turkiye Recep Tayyip Erdogan
🇨🇳 President of China Xi Jinping
🇧🇾 President of Belarus… pic.twitter.com/vXRnW6Vghs
This will be an intriguing BRICS summit for a number of reasons. Not only will it be the first annual BRICS summit in which the 5 new BRICS member countries of Saudi Arabia, the United Arab Emirates (UAE), Iran, Egypt and Ethiopia will be attending as full members alongside Brazil, Russia, India, China and South Africa, but it is also expected that this summit could see an announcement about the use of gold as part of an international settlement mechanism in a common unit of account called (UNIT).
The UNIT will be an international unit of account, 40% pegged to the value of gold, and 60% to a basket of BRIC country national currencies.
Andrey Mikhailishin, head of financial services task force of the BRICS Business Council, told TASS news agency in September that a number of BRICS financial system projects are being developed and could be announced at the summit, including not only the UNIT, but also an international settlements for BRICS digital currencies (Bridge), a payment system (Pay), and a settlement depository (Clear).
It looks like this BRICS UNIT will draw heavily on the gold-backed units which have already been studied and planned in depth by Russia and the Eurasian Economic Union (EAEU), as its proposed structure is similar to other gold, currency basket and commodity basket international payment and settlement instruments that have in recent years been designed for the EAEU by Russian politician and economist Sergei Glazyev (currently Commissioner for Integration and Macroeconomics of the commission which oversees the EAEU), and Sergei Silvestrov of the Russian Security Council’s scientific council. See BullionStar article “Moscow World Standard to Destroy LBMA’s Gold Monopoly" for further details.
Conclusion
The spot gold price has experienced rapid and remarkable increases since March 2024, and has recorded consistent new all-time highs across all major fiat currencies.
This gold price bull market of 2024 is being driven by a broad and varied array of factors, and is now ‘firing on all cylinders’. Specifically, the surge in gold prices is being driven by a combination of increased geopolitical concerns, conflict in the middle east and Ukraine/Russia, a shift in central bank monetary policy to a rate cutting cycle, rising inflation fears, a de-dollarisation trend, and speculative activity on gold derivatives exchanges.
The breadth of contributing factors and the fact that most of these factors are non-temporary adds credence to the argument that this gold price rally is not temporary, but that it’s just beginning.
Additionally, with global debt 17 times larger than the value of all known above ground gold stocks, and global money supply 5.8 times larger than value of all known above ground gold stocks, the gold price would have to rally multiples from here to even partially back global debt or global money supply. Not to forget that the inflation-adjusted price of gold (as calculated by ShadowStats CPI methodologies) puts the real inflation adjusted price of gold at $29,170, which is 11 times higher than the current spot price of gold.
Despite the significant rise in the gold price from $ 2000 to over $ 2650 since early March, this gold price rally remains under the radar for many investors, particularly in Western markets. As to how strong and persistent this gold price rally could be, perhaps the best comparison is the 1970s, as the set of factors influencing this current gold price bull market are similar to the set of factors which created a multi-year gold bull market in gold during the 1970 and into 1980s.
On that occasion, similar to now, there was heightened geopolitical and conflict (such as the Vietnam war, Iranian revolution, and Afghan war), high inflation and high inflation expectations, a loss of confidence in fiat currencies, and speculative activity in gold futures markets. There is also now the possibility that a wider war in the Middle East could send the oil price far higher (remember the oil price inflation of the 1970s). Many of the years during the 1970s saw the gold price rise by large double digits, such as over the 1972-1974 period, and particularly over the 1977 – 1980 period, which included 1979, when the gold price rose in one year by a staggering 133%.
While the evolution of asset prices, including gold prices, don’t always repeat themselves, they can, as in the case of history, often rhyme.
Popular Blog Posts by Ronan Manly
 How Many Silver Bars Are in the LBMA's London Vaults?
 ECB Gold Stored in 5 Locations, Won't Disclose Gold Bar List
 German Government Escalates War On Gold
 Polish Central Bank Airlifts 8,000 Gold Bars From London
 Quantum Leap as ABN AMRO Questions Gold Price Discovery
 How Militaries Use Gold Coins as Emergency Money
 Hungary Announces 10-Fold Jump in Gold Reserves
 Planned in Advance by Central Banks: a 2020 System Reset
 China’s Golden Gateway: How the SGE’s Hong Kong Vault will shake up global gold markets